Related:
Vivek Wadhwa, BusineesWeek: The Science Education Myth
American Friends Service Committee: LABOR MOBILITY AND THE GLOBAL ECONOMY
PhDs.org: Science, Math, and Engineering Career Resources http://www.phds.org/
Urban Institute: The Real Technology Challenge (Research Report)
"It's a very serious proposal," says Lofgren. "The IEEE lays out in stark terms that there is an obvious shortage of qualified U.S. graduates, and it only makes sense to allow exceptional people the chance to stay here and innovate instead of forcing them back to form startups in other countries."
BusinessWeek: Zoe Lofgren (D-Calif.), chair of the House subcommittee, comment on the IEEE_USA green-card expansion proposal.
Zoe Lofgren (D- Calif.) "…obvious shortage of qualified U.S. graduates…"
Extrapolated from the American Society for Engineering Education data, "Engineering By the Numbers" Michael T. Gibbons (PDF)
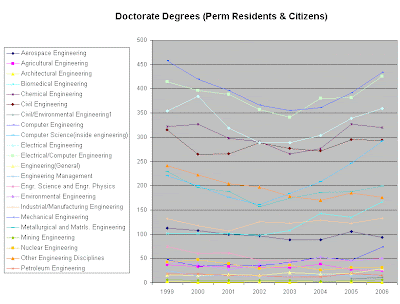
DOCTORAL DEGREES 1999-2006 = 23,257
MASTERS DEGREES 1999-2006 = 155,298
BACHELOR'S DEGREES 1999-2006 = 685,007
DOCTORAL DEGREES 1999-2006 = 23,257
MASTERS DEGREES 1999-2006 = 132,041
BACHELOR'S DEGREES 1999-2006 = 552,966
Engineering Degrees 1999-2006: individual Perm-Residents and Citizens = 708,264
Authors note: The aggregate ASEE Engineering degree data is not directly relational to BLS-OES aggregates. Foreign and Domestic yearly student ratios are reported by the ASEE, by degree level. Assuming these ratios are relevant to all fields of study, the following graph displays the top performing Engineering occupations and (all) domestic degrees awarded.

(Click image to enlarge)
BLS - OES Engineering occupations, sorted by Job growth 1999-2006.
Engineers, all other = 155,620
Industrial engineers = 42,430
Civil engineers = 27,590
Electronics engineers, except computer = 25,050
Aerospace engineers = 14,930
Mechanical engineers = 14,590
Computer hardware engineers = 14,060
Biomedical engineers = 7,580
Petroleum engineers = 5,420
Nuclear engineers = 5,290
Marine engineers and naval architects = 3,360
Agricultural engineers = 790
Chemical engineers = 430
Environmental engineers = -80
Mining and geological engineers, including mining safety engineers = -350
Materials engineers = -500
Electrical engineers = -1,540
Health and safety engineers, except mining safety engineers and inspectors = -15,850
Total BLS – OES Engineering Employment Growth = 298,820
Zoe Lofgren (D- Calif.) "…and it only makes sense to allow exceptional people the chance to stay here and innovate …"
"According to the American Society of Engineering Education (asee.org), foreigners account for nearly 45% of masters-level engineering students and 60% of PhDs."
Vivek Wadhwa, BusinessWeek: "The Visa Shortage: Big Problem, Easy Fix"
Cause for alarm? Justification for a massive increase in H-1B and green-card visas? Hardly, the fact that Mr. Wadhwa fails to mention, is that U.S. Educational capacity has grown over the years. According to the ASEE data, 3,212 Engineering PhDs were awarded to domestic students in 1999 and 3,198 domestic Engineering PhDs were awarded in 2006. (Fourteen fewer domestic PhDs than in 1999.) Domestic Masters Degrees in Engineering improved from 17,967 in 1999, to 23,487 in 2006.
Additionally, America already has a visa program to allow exceptional people a chance to stay.
The total number of Engineering PhDs awarded to foreign students in 2006 was 5,153, well within the annual 40,400 Employment-Based First Preference (E1) visa allotment.
The total number of Engineering Masters degrees awarded to foreign students in 2006 was 15,528, well within the annual 40,400 Employment-Based Second Preference (E2) visa allotment.
The total number of Engineering Bachelors degrees awarded to foreign students in 2006 was 5,341, well within the annual 40,400 Employment-Based Third Preference (E3) visa and recapture of unused (E2) visa allotment.
http://travel.state.gov/visa/immigrants/types/types_1323.html
Zoe Lofgren (D- Calif.) "…instead of forcing them [foreign students] back to form startups in other countries."
Zoe Lofgren has mixed apples with oranges with the previous statement, America has an adequate supply of Employment-based visa allotment to easily absorb 100% of the foreign-born Engineering students annually.
The H-1B, L-1 guestworker visa programs have caused the back-log in green-card applications. The H-1B and L-1 visa programs have broken the (EB) Employment-based path to citizenship. The H-1B and L-1 is the path to hireling peonage for skilled professionals both foreign and domestic.
Excessive immigration hyper-inflates the U.S. housing market, forcing salary requirements to exceed globally competitve levels. Yes, we need to allow these foreign students and guestworkers to go home to improve third-world economies – would we rather have highly-skilled Citizens be forced to go abroad and compete against us?
Addition views of 1999 - 2006 ASEE Engineering Data:


