The H-1B October 1st, employment commencement date, makes Fiscal Qtr1 (Oct. - Dec.) the most important time of the year for H-1B employers.
- The H-1B must be acclimated, a proficient knowledge-transfer in a technical field will run about 90 days.
- The domestic employee must be released before January 1st, to comply with Department of Labor 90 day severance rule when applying for new H-1B visas.
H-1B dependent employers and willful violator employers must attest to the following... "The employer will not displace any similarly employed U.S. worker within 90 days before or after applying for H-1B status, or an extension of status for any H-1B worker" http://www.dol.gov/compliance/guide/h1b.htm
Following this logic, Joe Sixpack, the Java slinging guru, is tasked with training his replacement on October 1, and is terminated effective December 31 (91 days before the April 1st.) Joe Sixpack was employed for Fiscal Qtr1, in its entirety. Therefore, Joe’s unemployment begins on the first day of the Fiscal Qtr2 (Jan. – Mar.)
In the following chart(s), I’ve downloaded BLS "Mass Layoff" data for the NAICS group, "Professional and technical services." Charts 1 - 4, are different views of the 1997 - 2006, mass layoff quarterly data.
This is as far as the BLS interface would allow me to "drill down" into Extended Mass Layoff data. I’ve posted the NAICS sub-codes to display that this category is the most vulnerable to H-1B replacement/displacement workers. (see Footnote 1)
Chart1 (click image to enlarge)
 In Chart 1, we see a dramatic increase in Qtr2 yearly Layoff events for "Professional and Technical services." If we ignore the years 2001-2003, we observe a trend shift in persons involved in mass layoffs in Fiscal Quarter 2. Instead of returning to the pre-recession ratios, the Qtr2 layoffs persist. (If the 2001 recession ended in 2003-- layoffs should have normalized in 2004.)
Chart 2 (click image to enlarge) Chart 2, groups fiscal quarters by year. Qtr2 layoffs remain stubbornly elevated, while other quarterly layoffs have returned to levels commensurate to pre 2001-2002 recession levels.
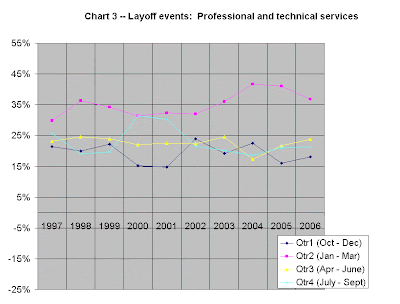
Chart 3 (click image to enlarge)
 In theory, layoff events should be equally distributed throughout the year, 25% per Fiscal Quarter. The Qtr2 layoff data indicates that the layoff ratios were behaving normally, even through the 2001 recession, Qtr2 layoffs began to spike in Fiscal year 2002. (The disturbance in 2000 - 2001 (Qtr1 & Qtr4) may be the related to the climax of theY2K buildup and emergency rebuilding of infrastructure after 9/11.)
Chart 4 (click image to enlarge)
If the case that elevated fiscal Qtr2 layoffs events are expected in business practice, isolating the Qtr2 data provokes more thought.
Chart4 Graph-points = Qtr2 - ((Qtr + Qtr3 +Qtr4)/3))
The current departure from the pre-2001 recession data is notable:
Avg. additional Qtr2 layoffs 1997 - 2000 = 12,167
Avg. additional Qtr2 layoffs 2001 - 2006 = 26,566
If I’ve done my math correctly, current Qtr2 (2001- 2006) layoffs are 235% of pre 2001 levels, or an additional 16,388 layoffs per year, above the 1997 - 2000 avg.
Just for conjecture let’s imagine that these 16,388 layoffs are the direct result of worker displacement, we can then determine how much money the State Unemployment Insurance programs and their re-insurers may be subsidizing the H-1B and other guestworker programs yearly.
The BLS report, Series Id: LEU0252881500, tells us that the median wage (second quartile) in the U.S. averaged $671.00 per week in 2006. Generally, unemployment benefits are 40% of the worker's previous weekly earnings, which would be $268.40 per week.
Estimated Impact to Unemployment Insurance programs and re-insurers:
- $4,398,777.78 per week
(Assume displaced American workers exhaust 26 weeks U.I.)
- $114,368,222.22 per year
Footnote 1:
http://data.bls.gov/PDQ/servlet/SurveyOutputServlet?&series_id=MLUQS00NN0035003
Series Id: MLUQS00NN0035003 (1)Data Element: Layoff eventsIndustry/Reason/Characteristic: Professional and technical servicesData Series: Extended Mass LayoffsState/Region/Division: United States
NAICS 541000 - Professional, Scientific, and Technical Services consists of:
NAICS 541100 - Legal Services
NAICS 541200 - Accounting, Tax Preparation, Bookkeeping, and Payroll Services
NAICS 541300 - Architectural, Engineering, and Related Services
NAICS 541400 - Specialized Design Services
NAICS 541500 - Computer Systems Design and Related Services
NAICS 541600 - Management, Scientific, and Technical Consulting Services
NAICS 541700 - Scientific Research and Development Services
NAICS 541800 - Advertising and Related Services
NAICS 541900 - Other Professional, Scientific, and Technical Services
Data available on request: netmenders2000@yahoo.com

1 comment:
Great work.
Post a Comment