Job Openings Data Misrepresented
Think tank personnel cannot read a simple chart, desperate to fool public?
Subjects:
shortage of STEM graduates,
Adams Nagar,
H-1B train your replacement,
Job Openings and Labor Turnover Survey,
Information Technology and Innovation Foundation ITIF
Adams Nagar, an Economic Research Analyst at the Information Technology and Innovation Foundation (a lobbyist think tank), has completely misrepresented the JOLTS (Job Openings and Labor Turnover Survey) data. On page 2 of "Looking Past the Loopholes: Are H-1Bs an 'Offshoring' Visa?", Nagar claims that there are 5.4 million job openings, but neglects to include that 5 million of those positions were filled in the same period. (This happens each and every month.)
Unable to interpret the simple Wall St. Journal chart that he linked to, perhaps Nagar is a prime example of an under-qualified U.S. worker that he references. He holds an M.A. in Political Economy and Public Policy and a B.A. in Economics and Political Economy from Wash. U.Adams Nagar, an Economic Research Analyst at the Information Technology and Innovation Foundation (a lobbyist think tank), has completely misrepresented the JOLTS (Job Openings and Labor Turnover Survey) data. On page 2 of "Looking Past the Loopholes: Are H-1Bs an 'Offshoring' Visa?", Nagar claims that there are 5.4 million job openings, but neglects to include that 5 million of those positions were filled in the same period. (This happens each and every month.)
Demand for technology workers has never been higher. Indeed, many of the record 5.4 million positions currently open in the United States are tied to the shortage of STEM workers.
Companies facing costly [H-1B] hiring difficulties face a tough choice: Remain uncompetitive with under-qualified U.S. workers, pay to poach workers from other companies and industries also facing shortages, fill the positions with foreign-born and often U.S.-educated professionals, or leave the position unfilled and forfeit an opportunity for growth.
Job Openings and Labor Turnover Survey (JOLTS)
The JOLTS survey measures actively recruited positions, as Job Openings. It also measures, Hires and Separations, categorized as quits, layoffs with no intent to rehire, discharge of the position or personnel etc. Basically, JOLTS simply measures "churn" or natural turnover in the labor market.The JOLTS data begins in December 2000, so I decided to take a look at, and chart, the long term averages. I found it interesting that for all of the years included in the data-set, even during recessions, Hires exceeded Job Openings, with the except being 2015. (This data to June 2015 and June is preliminary.)

The blue line in the chart above is the yearly average of Job Openings which finally returned to year 2000 levels. The red line, Hires, is currently averaging 369,600 below year 2000 levels. The yellow line (calculated by subtracting Opening from Hires (implied employment change)), is the amount the Hires have traditionally exceeded Job Openings, this year appears to be an outlier.
Although I hate to use Unemployment data because it does not include discouraged workers, I used it in the following chart because I wanted to compare those actively seeking employment to the active recruiting format the JOLTS provides in Job Openings.
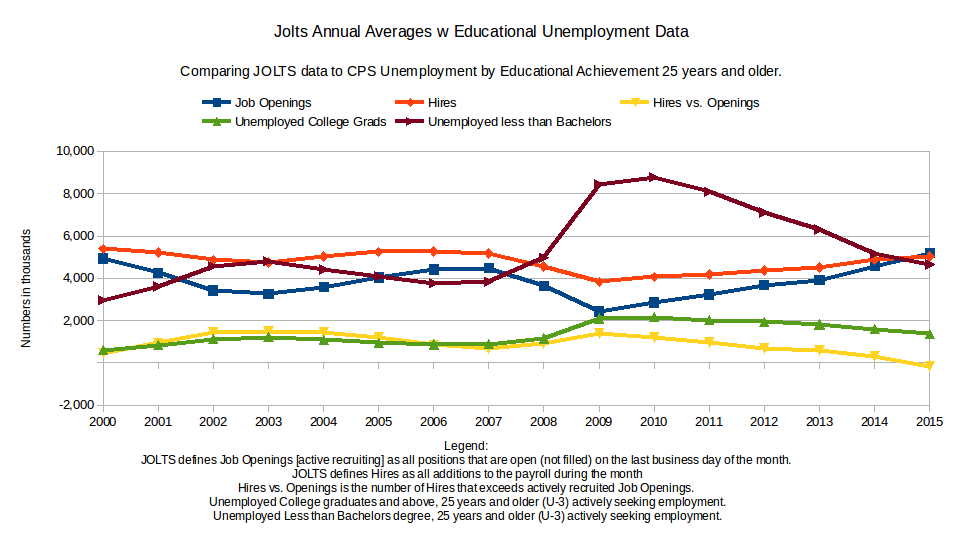
The above chart adds the JOLTS averages with Unemployment data (U-3) by educational level, this data is only available for ages 25 years and older.
The brown line represents headline unemployment levels (number of persons) with less than a bachelors degree. From 2007 to 2010, this group's unemployment levels grew by 4.95 million. Again, this population is likely to contain discouraged workers, which are not included in the U-3 displayed, but the steeply diving trend in this segment of the unemployed since 2010, makes it appear that the majority of hiring has occurred within the population with less than a bachelors degree.
The green line, represents those unemployed, 25 and older, with a bachelors degree and higher. Again, because this is U-3 Unemployment data, this represents people actively seeking employment. This data appears to be quite telling. For the years 2000 through 2008, we see that unemployment levels appear to be closely associated with the jobs which were not actively recruited (the yellow line, Hires vs. Openings). From 2008 forward, a gap has opened up between the non-actively recruited Hires and the formally educated and unemployed population.
Divergence: unemployed college grads and non-actively recruited Hires.
2007 = 202,333
2008 = 245,083
2009 = 711,167
2010 = 956,833
2011 = 1,064,000
2012 = 1,249,000
2013 = 1,227,167
2014 = 1,287,250
2015 = 1,535,433
Note that Unemployment levels for college graduates and above was 559,000 in December 2000 and is 1,307,000 for June 2015.
Before analyzing what is going on with the college graduates, I refer back to the chart, to point out that prior to 2009, the unemployment levels for those with less than a bachelors degree (brown line) also appears to have had a correlation with the non-actively recruited Hires.
Unemployment: less than a bachelors degree
When even the New York Times reports on it, it is no secret that the majority of recovery jobs have been created in low paying service industries. Automation is also constantly increasing, so the level of sophistication for some jobs is on the decline. Additionally, many college graduates are reporting that they are taking wrote service level jobs, bartender, waitress, Uber driver etc.Unemployment: bachelors degree and above
With the Unemployment levels in this population still 2.4 times higher than they were in December of 2000, there is either, no suitable jobs for them, an unwillingness to hire these workers, or many are not willing to settle for employment that does not fall within their discipline/meet their salary requirement.
An open search for advertised positions on Dice.com, the premier job website for technical employment yields 86,858 job listings, this is basically identical to pre-recession levels.
Adams Nagar, economics degree and all, must be living in some kind of parallel universe if he thinks that JOLT numbers, which have barely eclipsed December 2000 levels, have anything to do with demand for STEM workers and by extension H-1B visas.
There are already plenty of visas for "domestic" employers, but not if they are used for the "train your replacement" loophole, where those employee's only sin was to be more expensive than a foreign student who is attempting to jump the citizenship line through non-immigrant visa programs.
"Domestic" employers can't seem to come to terms with the fact that offshore outsourcing firms are the top users of and applicants for the H-1B visa. They are gaming the system, and in actual terms are foreign firms, or whose specialty is arbitraging jobs to foreign nations, benefiting from a program that was designed to help American employers.
No comments:
Post a Comment