Showing posts with label shortage. Show all posts

Monday, July 20, 2015

Microsoft Uses Women's Soccer Team to Regurgitate Faulty Data

Microsoft Uses Women's Soccer Team to Regurgitate Faulty Data

Microsoft's use of the US Women's Soccer Team and faulty data to try to increase immigration falls to a new low.


Subjects: shortage of Computer Science (CS) graduates, Women's Soccer, H-1B train your replacement, shortage debunked, Computer Science degrees

We gained some traction on "train your replacement" H-1B abuse.  Many thanks to the journalists who covered the stories.

Foremost, a big thank you to ComputerWorld's,  Patrick Thibodeau for his tireless work on covering the H-1B and foreign labor arbitrage topic. "About 500 IT jobs are cut at utility through layoffs and voluntary departures", February 4, 2015.


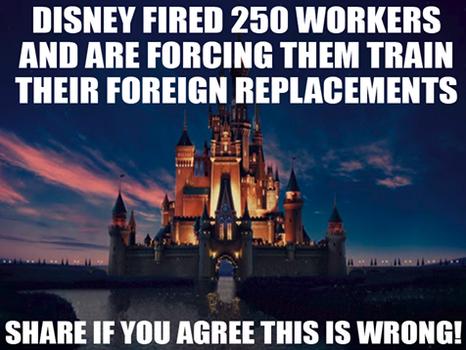
The New York Times, Pulitzer Prize winner, Julia Preston, who wrote, "Pink Slips at Disney. But First, Training Foreign Replacements", June 3, 2015, and was surprised enough about the comments on the article that she did a follow up article.

The Los Angeles Times
, Pulitzer Prize winner,   Michael Hiltzik, who covered the Southern California Edison labor arbitrage in, "A loophole in immigration law is costing thousands of American jobs" February 20, 2015. (Sorry, no links, The LA Times is currently behind paywall -- I guess I could delete their cookie.).


The Immigration shills waited a while and have now started regurgitating the faulty, data based, immigration attorney funded, H-1B (temporary foreign labor) propaganda.   The use of women's issues and the US National Soccer Team is a new angle though. The article is pretty well identified as propaganda and discussed on Slashdot.
 
Ten days ago, the United States women’s national soccer team became the most successful team in the history of the FIFA Women’s World Cup by winning the top prize for the third time. However, despite the fact that soccer is not as popular in America as in the rest of the world, it is not surprising that the U.S. women have been dominant in the sport in recent years. The explanation for that success lies in the talent pipeline. With over 1.5 million girls registered in youth leagues, close to 50 percent of all youth players in the U.S. are female and soccer is one of the top three most popular sports among girls ages 5-19.

We only get into the third paragraph before the author whips out the cherry picked graduation data and uses BLS projections rather than actual data.


Unfortunately, the strength in the talent pipeline that we see in female soccer today is not the reality for technology. The U.S. is facing a shortage of Computer Science (CS) graduates. According to the Bureau of Labor Statistics, every year there are close to 140,000 jobs requiring a CS degree, but only 40,000 U.S. college graduates major in CS, which means that 100,000 positions go unfilled by domestic talent. Even more dramatic is that women in U.S. colleges and universities earn only 18 percent of CS degrees."


First, Computer Science undergraduate degrees are not the only degrees that are applicable to Computer occupations.  Additionally, in 2011, the Census Bureau reports that, 1,013,300 (28%) of those employed in Computer occupations held less than a bachelor's degree.


Citizens and Permanent Residents


Computer related degrees conferred 2013TotalFemale-/- Percent Female
Master's Degrees12,7253,30325.96%
Bachelor's Degrees49,2048,72617.73%
Associate's Degrees38,6088,19821.23%


Total100,53720,22720.12%
Source: NSF WebCaspar, 11 Computer and Information Sciences and Support Services.


The Bureau of Labor Statistics projections is also rather suspect at 140,000 per year, in fact, since 2009, employment growth in computer occupations is less than 10% of projected, at 13,922.


Source: Bureau of Labor Statistics: OES

By the way, the H-1B initial employment approvals for Computer-related occupations was 80,877 for 2014 alone.  One year of H-1B intake exceeded five years of recession recovery growth of 69,610.


The latest five years of C.S. and C.I.S. graduation data (2009-13), for citizens and permanent residents only (Master's, Bachelor's and Associate) is 444,912 with 92,716 (20.84%) conferred to women. 

After this investment in time and resources, do our qualified women even get a tryout, when temporary foreign workers have a clear hiring preference?

Incidentally, are there any women with temporary visas on the U.S. Women's Soccer Team?

Thursday, May 21, 2015

Debunked: Shortage in Math and Computer Science


Debunked: Shortage in Math and Computer Science

Shortage of Computer Science and Mathematics Debunked -- Professionals crowded out by H-1B


Subjects: H-1B visa, STEM shortage myth, Bachelors Degree, STEM shortage debunked, Math and Computer Science degrees

I am surprised that I had not thought of approaching the STEM shortage myth in this manner before.  Math and Computer Science constitutes 50% of all STEM occupations and roughly 60% of all new H-1B visas are computer related. The H-1B visa program began in 1992; therefore, we can presume that Math and Computer Science occupations were primarily staffed with citizens and permanent residents in 1992.

NCSES ranked colleges conferred 2,317,505 Math and Computer Science degrees and certificates from 1992 to 2013, to citizens and permanent residents.  Using 1992 employment levels (1,830,800) as our baseline, we add the new degrees to the 1992 employment levels to find the size of our native Math and Computer Science workforce at 4,147,305


Math & CompSci 1992 - 2013

Employment levels

(15-000) Computer and Mathematical Occupations (2013) = 3,696,180
Math and Computer Science (1992) = 1,830,800

Growth levels

Employment Growth Since 1992 = 1,865,380
Mathematics and Computer Degrees & Certs (1992-2013) = 2,317,505

Employment deficit = 486,705 (13.17%)

Does not include foreign workers since 1992, nor foreign students.


Only counting domestic resources (citizens and permanent residents), we have educated half a million more Math and CompSci professionals than we employ.  This without considering the hundreds of thousands of H-1B, L-1, T-N (NAFTA), OPT and O visas granted annually.

So where is this shortage? The IT shortage that employers, trade associations and immigration attorneys write incessantly about?  (The occupations targeted with "shortage" adjective (traditionally Math & CompSci) has been expanded to STEM occupations, but that topic is for another paper.)

486,705 is a surplus of 9,734 formally trained professionals for every state in the nation, or a national surplus of 13.17%.  For retirement to be a factor, a significant portion of those employed in Math and Computer Science occupations would have had to have been 42 years old in 1992. Highly unlikely since IBM's MS-DOS was not introduced until August of 1981.


There are about 1.6 million H-1B working in the US, per USCIS 2014 data, 64.5% are in computer occupations. Roughly 1,032,000 H-1B in CompSci.

We also know from the Census Bureau (ACS), that a bachelors degree is not mandatory in computer science, 28% of those employed in computer occupations had less that a bachelors degree in 2011.  Aptitude can be proven with coursework, individual initiative, or both.
High School or less
Computer support specialists = 49,200
Computer occupations, all other = 31,800
Software developers = 22,400
Computer programmers = 21,800
Computer systems analysts = 20,800
Computer and information systems managers = 20,100

Some College or Associate’s Degree 
Computer support specialists = 210,700
Computer occupations, all other = 125,100
Computer and information systems managers = 116,500
Software developers = 114,700
Computer systems analysts = 98,700
Computer programmers = 94,300
Network and computer systems administrators = 87,200

Computer occupations less than bachelors degree (2011) = 1,013,300 (28.04%)

Computer occupations employment 2011 = 3,614,046
  • In 2011, Computer occupations accounted for 50% of all STEM occupations.
Detailed by field of degree from the same Census Bureau report, only 49% of those with Computers, mathematics, statistics degrees are working in STEM fields.  Under the twisted logic of trade-association's, open-borders propaganda, they would have you believe that this is due to these professionals finding better employment in other fields.  The reality is that these professionals have just as likely been crowded out of their chosen field by temporary foreign workers.

Census Bureau: Bachelor’s Degree for the First Listed Major: 2011
  • Computers, mathematics, and statistics = 1,879,764  
  • 51% not working in STEM = 958,679
 Source: Liana Christin Landivar, 2013, “The Relationship Between Science and Engineering Education and Employment in STEM Occupations,” American Community Survey Reports, ACS-23, U.S. Census Bureau, Washington, DC.


Math & CompSci Deficit Update 1992 - 2015

Employment levels

(15-000) Computer and Mathematical Occupations (2015) = 4,005,250
Math and Computer Science (1992) = 1,830,800

Growth levels

Employment Growth Since 1992 = 2,174,450
Mathematics and Computer Degrees & Certs (1992-2015) = 2,657,642

Employment deficit = 483,192 (12.06%)

Does not include foreign workers since 1992, nor foreign students.

Note 1: I became curious as to whether some degrees or certifications may have been granted to the same persons.  I ran the NSF/WEBCASPAR query again, this time selecting "Highest Degree (standardized):" rather than "Level of Degree or Other Award:" both queries yield the same result of 2,657,642.

Note 2: Employment growth in Math & CompSci, for the years 2013, 2014 and 2015, totaled was 397,360. Unemployment decreased from 3.6 to 2.6 percent, declining by 34,000 persons, but the employment deficit only declined by 3,513. Of the unemployment decline, only 10.33% came from the employment deficit I've described in this paper.

For 2013 and 2014, 160,747 new H-1B temporary workers were added to the Computer related occupations. 401,922 new citizen and permanent resident degrees and certifications (2013 (127,260), 2014 (135,176) and 2015 (139,486)), would have kept pace with the increase in employment levels without the need for temporary workers.


Degrees & Certs, Math & CompSci 1992-2015

Year: 2015, 2014, 2013, 2012, 2011, 2010, 2009, 2008, 2007, 2006, 2005, 2004, 2003, 2002, 2001, 2000, 1999, 1998, 1997, 1996, 1995, 1994, 1993, 1992
Citizenship (standardized): U.S. Citizens and Permanent Residents
Academic Discipline, 2-digit Classification of Instructional Program (CIP): 11 Computer and Information Sciences and Support Services, 27 Mathematics and Statistics
Level of Degree or Other Award: All values
Academic Discipline (CIP) Level of Degree or Other Award Citizens & perm. residents
11 Computer and Information Sciences and Support Services Doctorate Degrees 8,532
Doctorate Degree-Research/Scholarship 5,384
Doctorate Degree-Professional Practice 54
Doctorate Degree-Other 152
Master's Degrees 225,622
Bachelor's Degrees 912,140
Associate's Degrees 640,889
Post-Master's Certificates 2,120
Post-Baccalaureate Certificates 12,944
2 But Less Than 4 Year Certificates 12,265
1 But Less Than 2 Year Certificates 151,910
Less Than 1 Year Certificates 235,698
Subtotal 2,207,710
27 Mathematics and Statistics Doctorate Degrees 10,154
Doctorate Degree-Research/Scholarship 5,779
Master's Degrees 70,559
Bachelor's Degrees 336,521
Associate's Degrees 23,634
Post-Master's Certificates 1,069
Post-Baccalaureate Certificates 1,271
2 But Less Than 4 Year Certificates 3
1 But Less Than 2 Year Certificates 169
Less Than 1 Year Certificates 773
Subtotal 449,932
Mathematics and Computer total (1992-2015) 2,657,642


Data sources:
  • Occupational statistics data: http://www.bls.gov/oes/tables.htm
  • IPEDS Completions Survey by Race https://ncsesdata.nsf.gov/webcaspar/
  • USCIS Reports and Studies https://www.uscis.gov/tools/reports-studies/reports-and-studies
  •  Source: Liana Christin Landivar, 2013, “The Relationship Between Science and Engineering Education and Employment in STEM Occupations,” American Community Survey Reports, ACS-23, U.S. Census Bureau, Washington, DC. 

Saturday, October 15, 2011

Show Us The Workers -- Here You Go


"Show Us The Workers - U.S. Employers Struggle to Fill Science, Technology, Engineering and Math ("STEM") Positions" is a published challenge made by Shanon R. Stevenson, of Fisher and Phillips LLP, a group of immigration attorneys in Atlanta, Georgia.  The challenge is to disprove the "shortage of STEM workers" propaganda promoted by immigration attorneys and lobbyists.  In her 2 page PDF document, Ms. Stevenson references a DOL publication, Foreign Labor Certification Annual Report, which is where I discovered the data for Table 2 and Table 3 of this document.

Ms. Stevenson writes:
"Despite the recession, the lack of jobs and the training fees charged to U.S. employers hiring foreign workers on temporary H-1B work visas, the U.S. Department of Labor’s ("USDOL") recently released Foreign Labor Certification Annual Report shows that U.S. employers are still struggling to find qualified U.S. workers in the fields of Science, Technology, Engineering and Math ("STEM"). Employers report recruiting for STEM positions for over two years in hopes of ultimately finding a qualified U.S. worker – often resulting in the employer losing lucrative contracts or having to resort to using contract workers."
Generally, when a firm is looking for new STEM talent, they look to the colleges, here's a table of the degrees conferred in areas that are rich in STEM curriculum for 2008 and 2009.

Table 1. 
NCES U.S. Citizen and Permanent Resident STEM Related Degrees Conferred 2008 and 2009


Year: 2009, 2008
Citizenship (standardized): U.S. Citizens and Permanent Residents
Academic Discipline, 2-digit Classification of Instructional Program (CIP) Doctorate Degrees Doctorate Degree-Research
Scholarship
Master's Degrees Bachelor's Degrees Associate's Degrees Total 2008 and 2009
03 Natural Resources and Conservation 585 208 4,802 19,033 2,388 27,016
04 Architecture and Related Services 143 88 10,795 19,267 1,125 31,418
10 Communications Technologies/Technicians and Support Services 6 752 9,760 8,904 19,422
11 Computer and Information Sciences and Support Services 974 423 19,387 73,795 57,910 152,489
14 Engineering 4,136 2,410 38,459 131,645 4,373 181,023
15 Engineering Technologies/Technicians 54 7 4,444 29,557 60,724 94,786
26 Biological and Biomedical Sciences 6,979 2,800 16,305 155,964 4,482 186,530
27 Mathematics and Statistics 1,001 456 6,349 29,343 1,698 38,847
40 Physical Sciences 3,798 1,824 8,376 42,710 3,874 60,582
41 Science Technologies/Technicians 5 45 599 2,817 3,466
51 Health Professions and Related Clinical Sciences 12,245 2,263 116,062 230,794 323,051 684,415
Degrees Conferred 29,926 10,479 225,776 742,467 471,346 1,479,994

From the Foreign Labor Certification Annual Report, the occupations with more than 1000 Permanent (Residence) Labor Certifications are shown in Table 2, with the Office of Employment Statistics employment levels and Loss Gain.

Table 2. 
TOP PERM Labor Certifications and Employment by Occupation.


OCC_Code OCCUPATIONS WITH MORE THAN 1,000 PERMANENT LABOR CERTIFICATIONS Number of Certifications OES Employment  2010 OES Employment  2009 Employment Loss Gain
15-1031 Computer Software Engineers, Applications 9,854 499,280 495,500 3,780
15-1051 Computer Systems Analysts 5,695 495,800 512,720 (16,920)
15-1032 Computer Software Engineers,Systems Software 4,038 378,920 385,200 (6,280)
11-3021 Computer and Information Systems Managers 1,893 288,660 287,210 1,450
17-2072 Electronics Engineers,Except Computer 1,738 133,660 135,990 (2,330)
13-2011 Accountants and Auditors 1,595 1,072,490 1,106,980 (34,490)
15-1021 Computer Programmers 1,536 333,620 3678,80 (34,260)
15-2031 Operations Research Analysts 1,432 62,210 60,960 1,250
19-3021 Market Research Analysts* 1,233 Non Equiv. SOC Non Equiv. SOC N/A
35-2014 Cooks, Restaurant 1,115 901,310 898,820 2,490
17-2141 Mechanical Engineers 1,074 234,400 232,660 1,740
13-2051 Financial Analysts 1,042 220,810 235,240 (14,430)
15-1071 Network and Computer Systems Administrators* 1,034 Non Equiv. SOC Non Equiv. SOC N/A
17-2071 Electrical Engineers 1,003 148,770 151,660 (2,890)
           
  Employment Loss Gain       (100,890)

"Non Equiv. SOC" Represents Standard Occupational Classifications that have substantially changed from 2009, to the 2010 NAICS standard.

Again, from the Foreign Labor Certification Annual Report, shown in Table 3 below is the Top 10 Prevailing Wage Determination for foreign workers; additionally, employment level data for 2009 and 2010 and a Loss Gain column shown.

Table 3.
TOP Prevailing Wage Determinations and Employment by Occupation.


Wage Prevailing Wage Determinations Most Frequent Users Num of PWD OES Employment  2010 OES Employment  2009 Employment Loss Gain
$41.30 Computer Software Engineers, Applications 9,282 499,280 495,500 3,780
$37.16 Computer Systems Analysts 3,330 495,800 512,720 (16,920)
$44.36 Computer Software Engineers, Systems Software 3,092 378,920 385,200 (6,280)
$42.44 Electronics Engineers,Except Computer 1,582 133,660 135,990 (2,330)
$28.87 Physical Therapists 1,441 180,280 174,490 5,790
$60.29 Computer and Information Systems Managers 1,412 288,660 287,210 1,450
$9.57 Landscaping and Groundskeepers 1,240 829,350 859,960 (30,610)
$35.30 Mechanical Engineers 1,239 234,400 232,660 1,740
$42.84 Financial Analysts 1,143 220,810 235,240 (14,430)
$32.52 Computer Programmers 1,101 333,620 367,880 (34,260)
Employment Loss Gain (92,070)


Table 3.(a) examines the Employment Level Loss Gain for 2010 and Includes Degrees Conferred in 2009 relevant to foreign worker most requested Prevailing Wage Determinations.

Table 3.(a)
Top Prevailing Wage Determinations, Employment Levels Loss/Gain, Degrees Conferred to Citizens and Permanent Residents

Department of Labor Prevailing Wage Determinations 2010 and Relevant Educational Programs for Occupation Number of DOL Prevailing Wage Determinations OES Employment Level (Loss Gain)  2010 Year: 2009 Citizenship (standardized): U.S. Citizens and Permanent Residents Level of Degree or Other Award: All values Year: 2009 Citizenship (standardized): U.S. Citizens and Permanent Residents Level of Degree: Bachelor's
Computer Software Engineers, Applications 9282 3,780    
Computer Software Engineers, Systems Software 3092 (6,280)    
14.09 Computer Engineering, General - - 6,197 4,005
11.07 Computer Science - - 10,308 7,155
11.01 Computer and Information Sciences, General - - 29,984 16,169
11.04 Information Science/Studies - - 9,078 4,707
11.08 Computer Software and Media Applications - - 8,523 2,796
Sub Total - - 64,090 34,832
Computer Systems Analysts 3330 (16,920)    
11.05 Computer Systems Analysis - - 1,749 923
Electronics Engineers,Except Computer 1582 (2,330)    
14.10 Electrical, Electronics and Communications Engineering - - 15,123 10,733
Physical Therapists 1441 5,790    
51.23 Rehabilitation and Therapeutic Professions - - 18,140 3,182
Computer and Information Systems Managers 1412 1,450    
52.12 Management Information Systems and Services - - 13,971 7,435
11.10 Computer/Information Technology Administration and Management - - 8,263 2,216
Sub Total - - 22,234 9,651
Landscaping and Groundskeepers 1240 (30,610)    
No NCES Educational Programs - - 0  
Mechanical Engineers 1239 1,740    
14.19 Mechanical Engineering - - 20,271 16,838
Financial Analysts 1143 (14,430)    
52.08 Finance and Financial Management Services - - 39,096 33,315
Computer Programmers 1101 (34,260)    
11.99 Computer and Information Sciences and Support Services, Other - - 3,690 589
11.02 Computer Programming - - 4,449 788
Sub Total - - 8,139 1,377

Degree Level: All Values:
Doctorate Degrees, Doctorate Degree-Research/Scholarship, Doctorate Degree-Professional Practice, Doctorate Degree-Other
Master's Degrees, Bachelor's Degrees, Associate's Degrees
First Professional Certificates (Post-Degree)
Post-Master's Certificates
Post-Baccalaureate Certificates 2 But Less Than 4 Year Certificates
1 But Less Than 2 Year Certificates, Less Than 1 Year Certificates

With employers complaining of a shortage of "qualified" candidates, the term "qualified candidate" cannot be considered entry level salary.  Therefore, Table 3.(b) should be a fair representation for comparing median salaries against foreign worker salary offers. (In most cases, the Prevailing Wage Determination is low enough to recoup immigration and legal fees associated with employing foreign workers in the first year of employment.)


Table 3.(b)
Most requested Prevailig Wage Determinations with Office of Employment Statistics Mean Hourly wage for Occupations.


PWD Prevailing Wage Determinations (PWD) Most Frequent Users Num of PWDs 2010 OES Hourly Mean Wage OES Hourly Wage Delta Yearly Wage Differentlal per PWD
$ 41.30 Computer Software Engineers, Applications 9282 $ 43.47 $ (2.17) $ (4,513.60)
$ 37.16 Computer Systems Analysts 3330 $ 39.06 $ (1.90) $ (3,952.00)
$ 44.36 Computer Software Engineers, Systems Software 3092 $ 47.10 $ (2.74) $ (5,699.20)
$ 42.44 Electronics Engineers,Except Computer 1582 $ 44.58 $ (2.14) $ (4,451.20)
$ 28.87 Physical Therapists 1441 $ 37.50 $ (8.63) $ (17,950.40)
$ 60.29 Computer and Information Systems Managers 1412 $ 59.27 $ 1.02 $ 2,121.60
$ 9.57 Landscaping and Groundskeepers 1240 $ 12.23 $ (2.66) $ (5,532.80)
$ 35.30 Mechanical Engineers 1239 $ 39.65 $ (4.35) $ (9,048.00)
$ 42.84 Financial Analysts 1143 $ 41.36 $ 1.48 $ 3,078.40
$ 32.52 Computer Programmers 1101 $ 36.01 $ (3.49) $ (7,259.20)

Physical Therapists (Table 3.(b)) is highlighted to denote a large differential (Delta) between National Mean hourly wage and immigrant worker Prevailing Wage Determinations.


So, Ms. Stevenson, if there is demand for your immigration services, it isn't because there is a shortage of U.S. citizen or permanent resident candidates.   In the aggregate we have lost about 100,000 jobs in these "shortage" occupations. Even within the "growth" occupations, in almost all cases, foreign labor applicants exceeded employment growth; this fact absolutely disproves the labor shortage thesis.

For instance, within Computer Software Engineers, Applications, if 9,282 immigrants were added to the employment roles and the employment levels only rose by 3,780 there are 5,502 Computer Software Engineers, Applications specialists who are now unemployed.

Table 4: 
Occupational Majors: Employment Levels


OCC_CODE Occupational Title GROUP Employment 2010 Employment 2009 Employment 2008
00-0000 All Occupations total 127,097,160 130,647,610 135,185,230
11-0000 Management Occupations major 6,022,860 6,116,380 6,152,650
13-0000 Business and Financial Operations Occupations major 6,090,910 6,063,670 6,135,520
15-0000 Computer and Mathematical Occupations major 3,283,950 3,303,690 3,308,260
17-0000 Architecture and Engineering Occupations major 2,305,530 2,412,730 2,521,630
19-0000 Life, Physical, and Social Science Occupations major 1,064,510 1,308,380 1,296,840
21-0000 Community and Social Service Occupations major 1,901,180 1,891,320 1,861,750
23-0000 Legal Occupations major 992,650 999,020 1,003,270
25-0000 Education, Training, and Library Occupations major 8,457,870 8,488,740 8,451,250
27-0000 Arts, Design, Entertainment, Sports, and Media Occupations major 1,716,640 1,745,670 1,804,940
29-0000 Healthcare Practitioners and Technical Occupations major 7,346,580 7,200,950 7,076,800
31-0000 Healthcare Support Occupations major 3,962,930 3,886,690 3,779,280
33-0000 Protective Service Occupations major 3,187,810 3,172,420 3,128,960
35-0000 Food Preparation and Serving Related Occupations major 11,027,340 11,218,260 11,438,550
37-0000 Building and Grounds Cleaning and Maintenance Occupations major 4,175,550 4,269,480 4,429,870
39-0000 Personal Care and Service Occupations major 3,425,220 3,461,910 3,437,520
41-0000 Sales and Related Occupations major 13,437,980 13,715,050 14,336,430
43-0000 Office and Administrative Support Occupations major 21,503,800 22,336,450 23,231,750
45-0000 Farming, Fishing, and Forestry Occupations major 408,040 419,200 438,490
47-0000 Construction and Extraction Occupations major 5,072,530 5,751,630 6,548,760
49-0000 Installation, Maintenance, and Repair Occupations major 4,928,960 5,114,150 5,374,850
51-0000 Production Occupations major 8,236,340 8,927,130 9,919,120
53-0000 Transportation and Material Moving Occupations major 8,547,980 8,844,700 9,508,750


Table 5: 
Occupational Majors: Employment Loss Gain

OCC_CODE Occupational Title Loss Gain 2009-2010 Loss Gain 2008-2010
00-0000 All Occupations (3,550,450) (8,088,070)
11-0000 Management Occupations (93,520) (129,790)
13-0000 Business and Financial Operations Occupations 27,240 (44,610)
15-0000 Computer and Mathematical Occupations (19,740) (24,310)
17-0000 Architecture and Engineering Occupations (107,200) (216,100)
19-0000 Life, Physical, and Social Science Occupations (243,870) (232,330)
21-0000 Community and Social Service Occupations 9,860 39,430
23-0000 Legal Occupations (6,370) (10,620)
25-0000 Education, Training, and Library Occupations (30,870) 6,620
27-0000 Arts, Design, Entertainment, Sports, and Media Occupations (29,030) (88,300)
29-0000 Healthcare Practitioners and Technical Occupations 145,630 269,780
31-0000 Healthcare Support Occupations 76,240 183,650
33-0000 Protective Service Occupations 15,390 58,850
35-0000 Food Preparation and Serving Related Occupations (190,920) (411,210)
37-0000 Building and Grounds Cleaning and Maintenance Occupations (93,930) (254,320)
39-0000 Personal Care and Service Occupations (36,690) (12,300)
41-0000 Sales and Related Occupations (277,070) (898,450)
43-0000 Office and Administrative Support Occupations (832,650) (1,727,950)
45-0000 Farming, Fishing, and Forestry Occupations (11,160) (30,450)
47-0000 Construction and Extraction Occupations (679,100) (1,476,230)
49-0000 Installation, Maintenance, and Repair Occupations (185,190) (445,890)
51-0000 Production Occupations (690,790) (1,682,780)
53-0000 Transportation and Material Moving Occupations (296,720) (960,770)
Employment Loss Gain (3,550,460) (8,088,080)


Source Data:
National Science Foundation WebCASPAR (Educational Statistics)
https://webcaspar.nsf.gov/index.jsp?subHeader=WebCASPARHome

U.S. Department of Labor
Foreign Labor Certification Annual Report

Bureau of Employment Statistic: Office of Employment Statistics
http://www.bls.gov/oes