Showing posts with label H-1B. Show all posts

Thursday, October 27, 2016

H-1B Lottery Application Abuse

H-1B Lottery Application Abuse

H-1B applications nine times the amount of job growth.


Subjects: Labor Condition Application, H-1B, Employment, Keep America at Work


Keep America at Work posted some LCA data today, which reminded me that I wanted to see some comparisons.

9 H-1B applications compared to each job in the prior years's growth?  The Computer Systems Analysts occupation only employs 556,660, adding 272,221 (H-1B) would be a 49% increase. The occupation has only grown 38,430 since 2008.

The H-1B program is obviously being abused by overwhelming the system with free applications. It is the equivalent to the government giving away free lottery tickets. All the employer has to do is apply, the application fees are paid only if the visa selected in the lottery -- all other applications are returned unopened -- i.e., those checks are not cashed.  An H-1B Dependent employer can apply for 10,000 H-1B visas, without incurring the $40 million that it should cost to do so.

(I.e., Foreign outsourcers apply for 20 visas, even though they only need one. Stacks the odds in their favor and costs them net nothing.)


Giveaway to H-1B Employers Opens Huge Hole in USCIS Budget


H-1B Applications
https://www.foreignlaborcert.doleta.gov/pdf/PerformanceData/2016/H-1B_Selected_Statistics_FY2016_Q3.pdf


Employment levels May 2015
http://www.bls.gov/oes/current/oes_nat.htm

Historical employment levels
http://www.bls.gov/oes/tables.htm

Saturday, May 21, 2016

How many H-1B in the United States?

How many H-1B in the United States?

Many more H-1B than the experts have estimated


Subjects: H-1B, Michelle Malkin, Center for Immigration Studies, Economic Policy Institute

At about 13:00 mmss in the accompaying video, Malkin looks to the panel for confirmation that 650,000 H-1B are in the country.  USCIS reports indicate the number of H-1B filing for ACWIA fees is 1.6 million during the most recent six year period.

Adjustments, put the number of H-1B working in the US at about 1.07 million, but we only account for six years on the AC21 backlog -- which is still H-1B status.  It is known that there are H-1B backlogged in AC21 since 2012, but that number is not possible to quantify due to an unknown number of departures.


In, "Temporary foreign workers by the numbers", By Daniel Costa and Jennifer Rosenbaum • March 7, 2017, the Economic Policy Institute (EPI) declares that there are 460,749 H-1B working in the United States. 

The EPI report completely ignores the population of H-1B from the prior decade, who are beyond the six year limitation, living and working in the US on AC21 extension.  EPI actually deducts two years of these H-1B extensions (52,184) from their estimate.  These individuals are still in H-1B status!


So I guess EPI's logic goes as follows: in addition to H-1B exemption to the rule concerning direct replacement of professionals performing the job, exemptions to the statutory caps for certain types of employers, an extension for STEM-OPT students to work 3 years before the H-1B is granted and the AC21 permanent extension (beyond the six year statutory limigation) for those who can find a sponsor, the EPI arbitrarily removes a huge population, who are technically still on H-1B.

Until the AC21 petitioner secures another form of Employment Authorization Document (EAD), they are collateral damage from the H-1B and remain classified as such.  They are primarily foreign undergraduates who have not completed an FBI background check and the labor certification for the jobs they hold are postponed years beyond the H-1B six year limitation.

Some of the data the EPI uses comes from the USCIC "FY 20xx Annual Report: H-1B Petitions" reports. We can do a sanity check for a six year period to gauge how many light-years the EPI is off on its estimate.


H-1B: Filed (ACWIA fee)
2010 =  247,617
2011 =  267,654
2012 =  307,713
2013 =  299,467
2014 =  318,824
2015 =  348,669

Total = 1,789,944


H-1B: Approved and approval rate  (ACWIA fee)
2010 =  192,990 (77.94%)
2011 =  269,653 (100.75%)
2012 =  262,569 (85.33%)
2013 =  286,773 (95.76%)
2014 =  315,857 (99.07%)
2015 =  275,317 (78.96%)

Subtotal = 1,603,159 (89.56%)


H-1B: Change of employer (Fraud detection fee)
2010 = 27,551
2011 = 40,476
2012 = 37,290
2013 = 43,400
2014 = 51,029
2015 = 50,504

Subtotal = 250,250

Total = 1,352,909
(Approved ACWIA Fees w Change of employer  Fraud Deduction Fee instances deducted).


If we include a commensurate EPI estimate of LPR status awarded to H-1B (2 x 139,303 = 278,606), this still leaves us with 1,074,303 approved ACWIA filings -- 614,154 more than the EPI's estimate.


Update:
Zamora: H-1B adjustment of status to Legal Permanent Resident (LPR)


2010 = 40,717
2011 = 47,764
2012 = 42,318
2013 = 49,221
2014 = 42,167
2015 = 44,437 (avg. of prior yrs.)

Total H-1B to LPR= 266,624

Note 1: The 1 year extensions, deducted by EPI (52,184 for two years), are still H-1B visas, there is no reason for EPI to deduct these H-1Bs to arrive at, "...H-1B workers were employed in the United States..." (on page 18).

Note 2: 
Because of the (purported) six year limitation on H-1B visa, this data does not consider AC21 extensions prior to 2010.  USCIS and EPI claim that these extensions are filed either annually, or triennially.  The presumption made here is annually, as only paying the ACWIA fee every third year would markedly increase the estimate of those on AC21 extension.

Note 3: The number of second extensions for 2010 to 2015 was 225,807, which again is a mixed bag of single-year and three-year extensions. We know that some green card categories are backlogged 12 years, so a sample of 2010 to 2015 would not be all inclusive. The number of adjustments to LPR status deducted from this data-set exceeds second extensions; therefore, renewals of second extensions (regardless of duration) are statistically irrelevant to the total.

Source Data:

Table 3. Number of H-1B Petitions Approved by Quarter and Reason of Exemption from ACWIA Fee: FY 20xx
Table 5. Number of H-1B Petitions Approved Requiring Fraud Prevention and Detection Fee: FY 20xx
https://www.uscis.gov/tools/reports-studies/reports-and-studies
Zamora: "Are 'Temporary Workers' Really Temporary? Turning Temporary Status into Green Cards"
EPI: "Temporary foreign workers by the numbers"

Friday, November 20, 2015

Immigration Moratorium; Chapter 1

Immigration Moratorium

  Chapter 1: College Outcomes vs. Employment Growth


Subjects: Immigration moratorium, employment, college outcome, unemployment, H-1B,Green Card

The high-skill immigration debate is turning toward stapling a Green Card to U.S. conferred degrees. (The globalists call them advanced degrees without any further specificity, so we'll assume bachelors degrees and above in this exercise.)
College Outcomes vs. Employment Growth cap and gown image


Instead of writing about H-1B, this exercise coaxes college outcome data out of BLS Employment growth statistics verses Permanent Resident and Citizen bachelor's degrees conferred (U.S.) to find a "Not Employed" rate.  

The following section in the table displays the bachelors degrees and above and how that  "Not Employed" rate is changed as we accept more (U.S. college educated) Temporary Residents (non-citizens).

Retirement for those 65 and older are subtracted from the U.S. degrees conferred yearly at the rate of their presence in the population for the subject year. (A generous deduction since this percentage grows yearly and those degrees were conferred 40 years ago).

Finally, the original Employment Growth data does not match the available educational data, I adjusted that "Not Employed" rate in the final section of the table.  (I'm not calling it an unemployment rate because it would not be technically accurate.)


Bachelors Degree Employment Outcomes Since 2000


Citizen and PermRes Bachelors Degrees Conferred (2000-13)20,720,142
Retirement (aging out) Bachelors Since December 1999-3,420,761


Bachelors Degrees Adjusted Growth17,299,381
BLS Employment Growth Bachelors (Dec. 1999 - Oct. 2015)16,189,000


Bachelors Degree Not Employed1,110,381
Bachelors Degree Not Employed (Percent - U.S. only)6.42%


Temporary Resident Degrees Conferred (2000-2013)
Bachelors 661,474
Masters1,044,480
Doctorate126,813


Not Employed Percent with TempRes Degrees Added
Bachelors 10.24%
Masters12.46%
Doctorate7.15%


Total Not Employed Bachelors (w Res and Non res.)17.01%


Rollback Employment to 2013 Levels (to match EDU data)13,876,381
Bachelors Degrees Adjusted Growth (U.S. Citizen and PermRes.)16,189,000


Bachelors Degree Not Employed (U.S.)2,312,619
Temporary Resident Degrees Conferred (2000-2013)1,832,767


Bachelors Degree Not Employed (Percent)27.99%

Notes:  The number of Doctorate degrees conferred to Temporary Residents is miniscule over the 14 year period, 100% of the bachelors degrees are unnecessary as is some portion of the masters degrees.  The yearly average is 130,912.

Not all foreign students foreign student will be interested in staying, the current employment-based Green Card caps of 140,000 is adequate.  All temporary immigrant programs are likely unneeded.

* I noticed that when I rolled back the "Not Employed" to EOY 2013 levels, I did not subtract the 853,000 degree holders who had not yet retired.


Educational Data Source: https://ncsesdata.nsf.gov/webcaspar/ 
Employment and Population Data Unadj. (Current Population Survey - CPS) Source: http://www.bls.gov/data/

Monday, July 20, 2015

Microsoft Uses Women's Soccer Team to Regurgitate Faulty Data

Microsoft Uses Women's Soccer Team to Regurgitate Faulty Data

Microsoft's use of the US Women's Soccer Team and faulty data to try to increase immigration falls to a new low.


Subjects: shortage of Computer Science (CS) graduates, Women's Soccer, H-1B train your replacement, shortage debunked, Computer Science degrees

We gained some traction on "train your replacement" H-1B abuse.  Many thanks to the journalists who covered the stories.

Foremost, a big thank you to ComputerWorld's,  Patrick Thibodeau for his tireless work on covering the H-1B and foreign labor arbitrage topic. "About 500 IT jobs are cut at utility through layoffs and voluntary departures", February 4, 2015.


The New York Times, Pulitzer Prize winner, Julia Preston, who wrote, "Pink Slips at Disney. But First, Training Foreign Replacements", June 3, 2015, and was surprised enough about the comments on the article that she did a follow up article.

The Los Angeles Times
, Pulitzer Prize winner,   Michael Hiltzik, who covered the Southern California Edison labor arbitrage in, "A loophole in immigration law is costing thousands of American jobs" February 20, 2015. (Sorry, no links, The LA Times is currently behind paywall -- I guess I could delete their cookie.).


The Immigration shills waited a while and have now started regurgitating the faulty, data based, immigration attorney funded, H-1B (temporary foreign labor) propaganda.   The use of women's issues and the US National Soccer Team is a new angle though. The article is pretty well identified as propaganda and discussed on Slashdot.
 
Ten days ago, the United States women’s national soccer team became the most successful team in the history of the FIFA Women’s World Cup by winning the top prize for the third time. However, despite the fact that soccer is not as popular in America as in the rest of the world, it is not surprising that the U.S. women have been dominant in the sport in recent years. The explanation for that success lies in the talent pipeline. With over 1.5 million girls registered in youth leagues, close to 50 percent of all youth players in the U.S. are female and soccer is one of the top three most popular sports among girls ages 5-19.

We only get into the third paragraph before the author whips out the cherry picked graduation data and uses BLS projections rather than actual data.


Unfortunately, the strength in the talent pipeline that we see in female soccer today is not the reality for technology. The U.S. is facing a shortage of Computer Science (CS) graduates. According to the Bureau of Labor Statistics, every year there are close to 140,000 jobs requiring a CS degree, but only 40,000 U.S. college graduates major in CS, which means that 100,000 positions go unfilled by domestic talent. Even more dramatic is that women in U.S. colleges and universities earn only 18 percent of CS degrees."


First, Computer Science undergraduate degrees are not the only degrees that are applicable to Computer occupations.  Additionally, in 2011, the Census Bureau reports that, 1,013,300 (28%) of those employed in Computer occupations held less than a bachelor's degree.


Citizens and Permanent Residents


Computer related degrees conferred 2013TotalFemale-/- Percent Female
Master's Degrees12,7253,30325.96%
Bachelor's Degrees49,2048,72617.73%
Associate's Degrees38,6088,19821.23%


Total100,53720,22720.12%
Source: NSF WebCaspar, 11 Computer and Information Sciences and Support Services.


The Bureau of Labor Statistics projections is also rather suspect at 140,000 per year, in fact, since 2009, employment growth in computer occupations is less than 10% of projected, at 13,922.


Source: Bureau of Labor Statistics: OES

By the way, the H-1B initial employment approvals for Computer-related occupations was 80,877 for 2014 alone.  One year of H-1B intake exceeded five years of recession recovery growth of 69,610.


The latest five years of C.S. and C.I.S. graduation data (2009-13), for citizens and permanent residents only (Master's, Bachelor's and Associate) is 444,912 with 92,716 (20.84%) conferred to women. 

After this investment in time and resources, do our qualified women even get a tryout, when temporary foreign workers have a clear hiring preference?

Incidentally, are there any women with temporary visas on the U.S. Women's Soccer Team?

Thursday, May 21, 2015

Debunked: Shortage in Math and Computer Science


Debunked: Shortage in Math and Computer Science

Shortage of Computer Science and Mathematics Debunked -- Professionals crowded out by H-1B


Subjects: H-1B visa, STEM shortage myth, Bachelors Degree, STEM shortage debunked, Math and Computer Science degrees

I am surprised that I had not thought of approaching the STEM shortage myth in this manner before.  Math and Computer Science constitutes 50% of all STEM occupations and roughly 60% of all new H-1B visas are computer related. The H-1B visa program began in 1992; therefore, we can presume that Math and Computer Science occupations were primarily staffed with citizens and permanent residents in 1992.

NCSES ranked colleges conferred 2,317,505 Math and Computer Science degrees and certificates from 1992 to 2013, to citizens and permanent residents.  Using 1992 employment levels (1,830,800) as our baseline, we add the new degrees to the 1992 employment levels to find the size of our native Math and Computer Science workforce at 4,147,305


Math & CompSci 1992 - 2013

Employment levels

(15-000) Computer and Mathematical Occupations (2013) = 3,696,180
Math and Computer Science (1992) = 1,830,800

Growth levels

Employment Growth Since 1992 = 1,865,380
Mathematics and Computer Degrees & Certs (1992-2013) = 2,317,505

Employment deficit = 486,705 (13.17%)

Does not include foreign workers since 1992, nor foreign students.


Only counting domestic resources (citizens and permanent residents), we have educated half a million more Math and CompSci professionals than we employ.  This without considering the hundreds of thousands of H-1B, L-1, T-N (NAFTA), OPT and O visas granted annually.

So where is this shortage? The IT shortage that employers, trade associations and immigration attorneys write incessantly about?  (The occupations targeted with "shortage" adjective (traditionally Math & CompSci) has been expanded to STEM occupations, but that topic is for another paper.)

486,705 is a surplus of 9,734 formally trained professionals for every state in the nation, or a national surplus of 13.17%.  For retirement to be a factor, a significant portion of those employed in Math and Computer Science occupations would have had to have been 42 years old in 1992. Highly unlikely since IBM's MS-DOS was not introduced until August of 1981.


There are about 1.6 million H-1B working in the US, per USCIS 2014 data, 64.5% are in computer occupations. Roughly 1,032,000 H-1B in CompSci.

We also know from the Census Bureau (ACS), that a bachelors degree is not mandatory in computer science, 28% of those employed in computer occupations had less that a bachelors degree in 2011.  Aptitude can be proven with coursework, individual initiative, or both.
High School or less
Computer support specialists = 49,200
Computer occupations, all other = 31,800
Software developers = 22,400
Computer programmers = 21,800
Computer systems analysts = 20,800
Computer and information systems managers = 20,100

Some College or Associate’s Degree 
Computer support specialists = 210,700
Computer occupations, all other = 125,100
Computer and information systems managers = 116,500
Software developers = 114,700
Computer systems analysts = 98,700
Computer programmers = 94,300
Network and computer systems administrators = 87,200

Computer occupations less than bachelors degree (2011) = 1,013,300 (28.04%)

Computer occupations employment 2011 = 3,614,046
  • In 2011, Computer occupations accounted for 50% of all STEM occupations.
Detailed by field of degree from the same Census Bureau report, only 49% of those with Computers, mathematics, statistics degrees are working in STEM fields.  Under the twisted logic of trade-association's, open-borders propaganda, they would have you believe that this is due to these professionals finding better employment in other fields.  The reality is that these professionals have just as likely been crowded out of their chosen field by temporary foreign workers.

Census Bureau: Bachelor’s Degree for the First Listed Major: 2011
  • Computers, mathematics, and statistics = 1,879,764  
  • 51% not working in STEM = 958,679
 Source: Liana Christin Landivar, 2013, “The Relationship Between Science and Engineering Education and Employment in STEM Occupations,” American Community Survey Reports, ACS-23, U.S. Census Bureau, Washington, DC.


Math & CompSci Deficit Update 1992 - 2015

Employment levels

(15-000) Computer and Mathematical Occupations (2015) = 4,005,250
Math and Computer Science (1992) = 1,830,800

Growth levels

Employment Growth Since 1992 = 2,174,450
Mathematics and Computer Degrees & Certs (1992-2015) = 2,657,642

Employment deficit = 483,192 (12.06%)

Does not include foreign workers since 1992, nor foreign students.

Note 1: I became curious as to whether some degrees or certifications may have been granted to the same persons.  I ran the NSF/WEBCASPAR query again, this time selecting "Highest Degree (standardized):" rather than "Level of Degree or Other Award:" both queries yield the same result of 2,657,642.

Note 2: Employment growth in Math & CompSci, for the years 2013, 2014 and 2015, totaled was 397,360. Unemployment decreased from 3.6 to 2.6 percent, declining by 34,000 persons, but the employment deficit only declined by 3,513. Of the unemployment decline, only 10.33% came from the employment deficit I've described in this paper.

For 2013 and 2014, 160,747 new H-1B temporary workers were added to the Computer related occupations. 401,922 new citizen and permanent resident degrees and certifications (2013 (127,260), 2014 (135,176) and 2015 (139,486)), would have kept pace with the increase in employment levels without the need for temporary workers.


Degrees & Certs, Math & CompSci 1992-2015

Year: 2015, 2014, 2013, 2012, 2011, 2010, 2009, 2008, 2007, 2006, 2005, 2004, 2003, 2002, 2001, 2000, 1999, 1998, 1997, 1996, 1995, 1994, 1993, 1992
Citizenship (standardized): U.S. Citizens and Permanent Residents
Academic Discipline, 2-digit Classification of Instructional Program (CIP): 11 Computer and Information Sciences and Support Services, 27 Mathematics and Statistics
Level of Degree or Other Award: All values
Academic Discipline (CIP) Level of Degree or Other Award Citizens & perm. residents
11 Computer and Information Sciences and Support Services Doctorate Degrees 8,532
Doctorate Degree-Research/Scholarship 5,384
Doctorate Degree-Professional Practice 54
Doctorate Degree-Other 152
Master's Degrees 225,622
Bachelor's Degrees 912,140
Associate's Degrees 640,889
Post-Master's Certificates 2,120
Post-Baccalaureate Certificates 12,944
2 But Less Than 4 Year Certificates 12,265
1 But Less Than 2 Year Certificates 151,910
Less Than 1 Year Certificates 235,698
Subtotal 2,207,710
27 Mathematics and Statistics Doctorate Degrees 10,154
Doctorate Degree-Research/Scholarship 5,779
Master's Degrees 70,559
Bachelor's Degrees 336,521
Associate's Degrees 23,634
Post-Master's Certificates 1,069
Post-Baccalaureate Certificates 1,271
2 But Less Than 4 Year Certificates 3
1 But Less Than 2 Year Certificates 169
Less Than 1 Year Certificates 773
Subtotal 449,932
Mathematics and Computer total (1992-2015) 2,657,642


Data sources:
  • Occupational statistics data: http://www.bls.gov/oes/tables.htm
  • IPEDS Completions Survey by Race https://ncsesdata.nsf.gov/webcaspar/
  • USCIS Reports and Studies https://www.uscis.gov/tools/reports-studies/reports-and-studies
  •  Source: Liana Christin Landivar, 2013, “The Relationship Between Science and Engineering Education and Employment in STEM Occupations,” American Community Survey Reports, ACS-23, U.S. Census Bureau, Washington, DC. 

Friday, November 21, 2014

OPT extension to cost current STEM workers 175.5 billion in earnings

Updated: November 21, 2014

American Tech Workers Successfully Win Standing to Sue on Alleged Illegal Issuance of STEM-Related Work Authorization

Source: Link

American workers at a huge hiring disadvantage.
* Judge recognizes that OPT foreign-workers are Social Security and Medicare exempt.

The Programmers Guild and the Immigration Reform Law Institute, have been denied a preliminary injunction against the Bush administration's 17 month extension of OPT-CPT training visas for foreign graduates studying STEM coursework.

Catch up on the details here:
Judge rejects student visa injunction sought by H-1B opponents
Patrick Thibodeau: Computerworld, August 7, 2008

Here's the problem:

"Hochberg's ruling focused less on the merits of the case and more on whether H-1B opponents had legal standing to bring it, noting that they could not show they had been directly hurt by the student visa extension."

One way to demonstrate direct harm to current STEM workers would be to show the effect of the added temporary foreign workers impacting the lifespan of the STEM career.

BLS STEM Employment 2005 = 5,228,040
Avg STEM Salary 2005 = $64,560.00

U.S. citizens and permanent residents:
Bachelors Degrees Science and Engineering (S&E) awarded

1995 = 363,463
1996 = 369,927
1997 = 373,745
1998 = 375,909
1999 = missing
2000 = 383,438
2001 = 384,492
2002 = 399,288
2003 = 421,730
2004 = 436,372

Total = 3,508,364
(389,818.22 avg. per yr.)

STEM Career to replacement factor (domestic) = 13.41 years
(2005 STEM employment divided by avg. S&E (citizen and perm res.) bachelor degree production.)

Assumptions:
* Domestic bachelor's degree production will increase naturally and congruent with demand.
* Bachelor's degrees are not the minimal educational requirement for all STEM occupations, but it would only take 13.41 years of bachelor degree production to replace the entire STEM workforce.
* S&E degrees are not the only degrees relevant to STEM occupations.

Baseline:
Without additional foreign labor supply, the average US, S&E undergraduate could expect a STEM career lifespan of 13.41 years, before being replaced by a domestic candidate with an updated degree. 

Source data: Institute of International Education

Nonresident aliens:
Bachelors Science and Engineering 
(S&E) awarded
1995 = 14,685
1996 = 14,747
1997 = 14,737
1998 = 14,709
1999 = missing
2000 = 15184
2001 = 15,714
2002 = 16,323
2003 = 17,704
2004 = 18,606

Total 142,409
(15,823.22 avg per yr.)

STEM Career to replacement factor (domestic & foreign grads) = 12.89 years
(2005 STEM employment divided by avg. S&E (citizen and perm res. plus nonresident alien) bachelor degree production.)

Lost career lifespan caused by retaining foreign S&E graduates via temp. visas = 0.52 years

Dollar impact to each current STEM worker = $33,571.20

Effect:
The effect of modifying immigration policy, with intent to retain all foreign S&E graduates in the tax subsidized OPT visa (Social Security and Medicare exempt), combined with the H-1B visa, which includes unlimited extensions (beyond the 6 year limitation) for Permanent Residency applicants,  is extremely detrimental to the competitiveness of the citizen and permanent residents.

Extending the OPT visa an additional 17 months, with CPT provisions for STEM students, ensures that a higher percentage of foreign-students will fall into the temporary-worker loophole, and that foreign-students will enjoy a hiring preference while transitioning from working-student status, to H-1B.    

Total lost earnings to citizen and perm res. STEM workforce = $175,511,576,448.00
(Employed STEM earnings lost in career lifespan, shortened by .52 years)

Source:
STEM Bachelor degree data
http://www.nsf.gov/statistics/nsf07308/tables/tab4.xls

STEM Employment data
http://www.bls.gov/opub/ooq/2007/spring/art04.pdf

Details on OPT - CPT status
http://www.ice.gov/sevis/practical-training

Source data for chart:
Institute of International Education

Sunday, July 27, 2014

Common Sense H-1B Reform

Over the last couple of years, the trend in the media has been to lament that we train foreign students in "advanced" STEM degrees here, and then send them home to compete against us, due to a shortage of H-1B visas. The fact that H-1B pundits are careful to use the word "advanced" instead of postgraduate has not escaped me.  In addition to the H-1B educational requirement being set too low, another source of H-1B lobbyist whining is the highly publicized H-1B lottery, which is likely caused by foreign outsourcing firms who suffer no financial penalty when attempting to game the system.

Adjust the H-1B educational eligibility requirement, not the yearly cap.


The logical thing to do is to raise the educational requirement for H-1B to a postgraduate degree.  According to the FY 2012, H-1B data, eliminating bachelors degree eligibility would free up 50% of new H-1B visas.

Data presented by Dr. Ron Hira, shows that legitimate US employers draw heavily from the postgraduate population, while offshore outsourcing firms favor undergraduate degrees.  Additionally, the offshore outsourcing firms have the unlimited Intra-company L-1 visa available to them, once the candidate has one year of experience with the firm.

By raising the H-1B educational requirement, citizen and permanent resident candidates would have a better chance at bachelors degree and associate degree level positions, which are the targeted positions to be moved offshore by the offshore outsourcing firms.  Restated, 50% more H-1B visas would be available to legitimate US employers.

According to the Institute of International Education, there were 311,204 foreign students enrolled in postgraduate programs in the United States in 2012-13.  This might seem like a large number until we factor in the Doctoral programs are four years, and masters and professional degree probably average two years. So the number likely to graduate in 2013 was roughly 126,157 for all declared and undeclared majors (not just STEM). Additionally, some students may not want to stay in the US and other might not graduate, but the 126,157 number is still less than the total number of H-1B initial employment approvals in FY 2012 (136,890),  

Work experience authorizations 


The IIE data also discloses that there were 94,919 international students gaining work experience on the Optional Practical Training (OPT), an unlimited cap, 12 month work permit with a 17 month extension available for STEM graduates.  While working on student visas, these employees are exempt from Social Security and Medicare tax, putting entry level citizens and permanent residents at a huge financial  disadvantage.

H-1B lottery and oversubscription


A second point of contention is the H-1B lottery, that is triggered when the number of applications exceed the 85,000 visa cap.  As reported by the Center for Immigration Studies, this phenomena is primarily caused by companies attempting to game the system.  Due to the fact that H-1B application fees are refunded to the applicant employer (unlike most other visa fees) there is no financial penalty for oversubscribing the H-1B category.

Gaming the number of applications


H-1B dependent employers, employers with a high percentage of H-1B staff, are eligible for something called a multi-slot  Labor Condition Application (LCA).  The multi-slot LCA allows, primarily outsourcing, firms to apply for an unlimited amount of H-1B visa on a single application -- without naming the candidate or providing credential for USCIS/DOL review.

The ability to apply for hundreds of H-1B visas, on a single application, with the knowledge that application fees will be refunded encourages these companies to oversubscribe the visa category, hoping that their consultant (possibly the same candidate) will be placed at the firms who could not attain the visa at a higher premium.  (I.e., if Microsoft doesn't win the lottery on a single LCA, the outsourcing firm, with the un-named H-1B LCAs, can provide the candidate as a consultant.)

Employment based (EB-3) permanent immigration oversubscription


Due to the dual-intent rules available in both the H-1B and L-1 temporary visas, employers can sponsor these employees for permanent residence.  Published figures estimate that there is a backlog of 500,000 workers in the EB-3 (bachelors degree level) employment based permanent residency program.  Due to country of origin limits, these immigrants are primarily from China and India and are on yearly AC21 extensions, taking them well beyond the 5 and 6 year limits of the L-1 and H-1B visas.

As such, bachelor degree permanent residency applicants from non-backlogged countries will gain permanent residency ahead of those on AC21 extension.  Raising the educational requirement for H-1B will reduce the intake of bachelors degree permanent residency applicants and vacant slots can be recovered and distributed to address the AC21 backlog.

Tuesday, July 15, 2014

Computer Occupations: H-1B 80% of (Recession Recovery) Employment Level Growth 2011-2013

During the "recovery" from the most severe economic times since the Great Depression, 80% of Computer Employment Growth went to new H-1B immigrants.

Recession and recovery periods are critically important, foreign labor work authorizations  during these periods must be highly scrutinized.


The BLS Occupational Employment Statistics (OES) offer us of view of the occupational levels from year to year.  Released in May of each year, the titles can be a bit misleading, for instance, the May 2013 report covers from the end of May 2012 through April 2013 -- so the MAY 2013 OES report in question aligns almost perfectly with the Fiscal Year 2012 H-1B Characteristics report from USCIS (Fiscal year begins on April 1).

The H-1B is a 3 year visa in its fist term, with a single 3 year extension and unlimited 1 year extensions for those who have secured PERM employment sponsorship for a Green Card. 

In order to compare employment level growth and H-1B foreign labor assumption of employment growth, we need to look at the 3 year period where the H-1B is known to have employment authorization.
 

H-1B New Employment Approvals  in Computer Occupations
FY 2012 = 83,444 (61.4% of total new approvals)
FY 2011 = 51,570 ( 48.9% of total new approvals )
FY 2010 = 31,661 ( 41.8 of total new approvals)
Total 166,675
Source: USCIS Reports and Studies
Concerning the employment level Gain or Losses, a portion of the Computer Occupations do not require a bachelors degree or higher and therefore, should not be eligible for the H-1B program.


Computer Occupations, 3 year Employment Level Loss Gain
Bachelors Degree or Higher = 206,240 *
Associate Degree =  73,870
* The Bachelors Degree or Higher contains Web Developers, which is an Associate Degree entry position, but that number cannot be extracted from this data-series.

 Once again, we see that of the employment growth that is H-1B eligible, 206,240  jobs, 166,875 of these jobs (89%) went to H-1B "temporary" immigrants.


Meanwhile, 235,818 entry degrees, 125,393 bachelors and 110,425 associate degrees, were awarded to citizens and permanent residents in Computer and Information Sciences and Support Services from 2010 to 2012.
Source: WebCaspar NCSES

Occupational Employment Statistics - Data


20112013Emp. Loss / Growth


Computer Occupations
3,293,0203,573,120


BachelorsAssociate
15-1111Computer and Information Research Scientists
25,16024,380-780

15-1121Computer Systems Analysts
487,740507,10019,360

15-1131Computer Programmers
320,100312,340-7,760

15-1132Software Developers, Applications
539,880643,830103,950

15-1133Software Developers, Systems Software
387,050373,510-13,540

15-1141Database Administrators
108,500114,9106,410

15-1142Network and Computer Systems Administrators
341,800362,31020,510

15-1150Computer Support Specialists
632,490706,360
73,870
15-1179Information Security Analysts, Web Developers, and Computer Network Architects
272,670332,11059,440 *
15-1799Computer Occupations, All Other*
177,630196,28018,650


Totals

3,293,0203,573,130206,24073,87026%
Source data: http://www.bls.gov/oes/tables.htm

Wednesday, May 14, 2014

Computer Occupations 2013: Winners & Losers

Winners and losers in the Computer-occupations for May 2013 from the BLS, Occupational Employment Statistics.  The overall employment level growth for the period was, 116,620.  In comparison, Employment growth for the prior year was 143,890  (May 2011 to May 2012).


Educational Requirement


Occupation code Occupation title Level Employment 2013 Employment 2012 Associate Bachelor Postgrad


15-1100 Computer Occupations minor 3,573,120 3,456,500 22,620 94,500 -500


15-1111 Computer and Information Research Scientists detail 24,380 24,880

-500


15-1120 Computer and Information Analysts broad 585,120


15-1121 Computer Systems Analysts detail 507,100 482,040
25,060


15-1122 Information Security Analysts detail 78,020 72,670
5,350


15-1130 Software Developers and Programmers broad 1,442,500


15-1131 Computer Programmers detail 312,340 316,790
-4,450


15-1132 Software Developers, Applications detail 643,830 586,340
57,490


15-1133 Software Developers, Systems Software detail 373,510 391,700
-18,190


15-1134 Web Developers detail 112,820 102,940
9,880


15-1140 Database and Systems Administrators and Network Architects broad 618,480


15-1141 Database Administrators detail 114,910 111,590
3,320


15-1142 Network and Computer Systems Administrators detail 362,310 350,320
11,990


15-1143 Computer Network Architects detail 141,270 137,890
3,380


15-1150 Computer Support Specialists broad 706,360


15-1151 Computer User Support Specialists detail 541,250 525,630 15,620


15-1152 Computer Network Support Specialists detail 165,100 167,980 -2,880


15-1199 Computer Occupations, All Other detail 196,280 185,730
10,550


22,620 94,500 -500


The May 2013 Occupational Employment Statistics data were released on April 1, 2014 and are available at www.bls.gov/oes/tables.htm.

Monday, March 17, 2014

Worse than warts: lawyers and lobbyists

"Politicians are like warts on the body of society. And the only thing worse than warts are lawyers and lobbyists."
― Jarod Kintz, Who Moved My Choose?: An Amazing Way to Deal With Change by Deciding to Let Indecision Into Your Life


I set off looking for quotes about lawyers and lying and found one above at Goodreads.
The Sacramento Bee has somewhat closed its comment policy, so I’ll make my comment here. Apparently, the word “Viewpoint” is now an acceptable replacement for “Editorial.”

Friday, September 13, 2013

STEM Crisis Myth


Three points of interest in this post.

A very good write-up on IEEE Spectrum, I hope they don’t mind that I’m using their image to encourage you to read their article.

The STEM Crisis Is a Myth

By Robert N. Charette
Posted 30 Aug 2013 | 19:28 GMT


“A Matter of Supply vs. Demand: Every year U.S. schools grant more STEM degrees than there are available jobs. When you factor in H-1B visa holders, existing STEM degree holders, and the like, it’s hard to make a case that there’s a STEM labor shortage.”

http://spectrum.ieee.org/at-work/education/the-stem-crisis-is-a-myth


09STEMeducation-1377102567732


Friday, July 26, 2013

Computer Occupations & H-1B Report 2012

135,966 H-1B initial employment approvals in FY 2012
  • In 2012, the H-1B cap of 85,000 was exceeded by 53,446. 
  • 83,444(61.4%) of 135,966 initial employment approvals, in known occupations, went to Computer-related occupations
  • Another 924 employment approvals went to Occupations unknown for a total of  136,890 employment approvals. 

Findings:

At the core of the temporary immigration problem is the static USCIS definition of the Specialty Occupation.  With a static definition of occupations that are open to temporary immigration, we can be assured that work authorizations will be wasted in occupations where they are unneeded, while industries having a genuine need will clamor for higher immigration rates .  Moreover, the temporary immigration programs are completely insensitive to occupational unemployment rates and current degree production.  Adding workforce capacity to occupations where employment levels are declining is –- flat stupid. 
USCIS still reports to Congress using the out of print Dictionary of Occupational Titles (DOT), there is no way to crosswalk DOT occupational titles to the Standard Occupational Classification (SOC) titles because many titles did not exist at the DOT last printing in 1991. The Bureau of Labor Statistics abandoned the DOT in 1998.

The US now has the capability to determine if individual occupational levels are growing,  if growth in an occupation is stagnant or declining it would be a very trivial process to ‘close’ the occupation to temporary immigration, thus freeing up visas for occupations that are experiencing growth. 

The one year (occupation specific) temporary immigration hiatus would reduce unemployment costs, student loan defaults and home loan foreclosures because it would provide a one year period where employers would be motivated to hire from the unemployment roles if they wish to participate in the early stages of recovery from economic recession(s).

Tuesday, May 15, 2012

STEM – Don’t Let This Happen to Your Job


The H-1B (High skill foreign labor) debate centers around the “Computer-related occupations” employment classification.  Computer-related occupations have borne the brunt of High Skill immigration policy,  Computer-related occupations is just 2.57% of the nation’s employment, but averages 46% of all new H-1B visas and 50% of all H-1B renewals.

image

(Table 1)

image

(Table 2)

The remaining H-1B visas are distributed among seventeen occupational groups when including, “Occupation Unknown”.  In addition to the H-1B visa, we have the L-1 Intracompany visa, which is nearly identical to the H-1B.  The table below uses the Computer-related occupation percentages from Table 1 (H-1B initial approvals), to estimate population of Computer-related (C&IS) L-1 visas.

image

(Table 3)

Temporary work visas are only part of the story, we need to examine the “Bright Outlook” occupations that the Bureau of Labor Statistics (BLS) are always pushing in Employment Projections.  The following table uses BLS Occupational Employment Statistics to determine employment level growth in Computer-related occupations. 

The “USA Jobs Remaining” column is the employment growth/loss with employment granted to temporary immigrants subtracted.

image

(Table 4)

Of course, H-1B and L-1 visas authorize employment for 3 years. We need to evaluate  the “USA Jobs Remaining” data in 3 year periods. Also note that temporary immigrant data for 2011 is still not published – so the statistic (table below) gets a “free” 117,500 jobs in 2011.

image

(Table 5)

The “USA Jobs Remaining” entries in Table 5 are a simple aggregate of the corresponding entries in the “USA Jobs Remaining” column in Table 4.  Recall that the 2011 temporary immigration data is unavailable, the  2009-11 statistic will only get worse.

Finally, we need to consider the Computer-related (C&IS) degrees conferred to citizens and permanent residents. Of course, the terms of the H-1B and L-1 visa is that there must be a job waiting upon arrival, so our students take a “back-seat” to the temporary immigrants.

image

(Table 6)

Some of the citizen and permanent resident students in Table 6 may already be employed, or may be in school full time in progress to a higher degree.  However, when they enter the workforce, they will be competing for employment with foreign students who enjoy a 29 month,  Social Security exempt while under a student visa, intern status on OPT.  (Qualified Foreign Students)

We’ve done a good job of warning American students to stay away from Computer Science majors, In the light of the USCIS announcing more eligible majors for the OPT classification, I assume the immigration lawyers are looking for other STEM occupations to victimize.

Source:

2011 OES Employment level data can be found at  National Cross-Industry 

OES Employment level data (National Cross Industry) for 1999-2010 Here

H-1B Characteristics Reports (2004 through 2010) can be found Here

L-1 visa data can be found Here (Excel)

The 1999 through 2003 H-1B Characteristics Reports appear to be unavailable online, data was taken from archive copies.

Educational data was downloaded from NSF resources before a change to the web interface. I do not know if it is still possible to query the data by residency status.

Monday, March 5, 2012

Incredible Elasticity in US Science and Engineering Labor Force

In 2010, the Unemployment level for the Science and Engineering Labor force was 426,215.  The average Science and Engineering Labor Force growth was 26,627 yearly (2005 to 2010).  During the same period, the Foreign Born, Science & Engineering Labor force grew by an average of 31,245 per year.

In terms of California Unemployment Benefit levels ($450.00 wk), the preference for foreign professionals costs the various State and Federal Unemployment Agencies $731,133,000.00 per 52 week period. 

See the US S&E heat map from the Population Reference Bureau (Link)

Excel MSA Employment Charts used in this presentation with other Metro Areas available for download. (File > Download)

The American Community Survey(Census ACS) provides data on the Science and Engineering (S&E) Labor Force statics.  The Unemployment level data include the foreign and native born.  It is important to remember that the “Labor Force” consists of the Employed” plus the “Unemployed” when evaluating the information to follow.

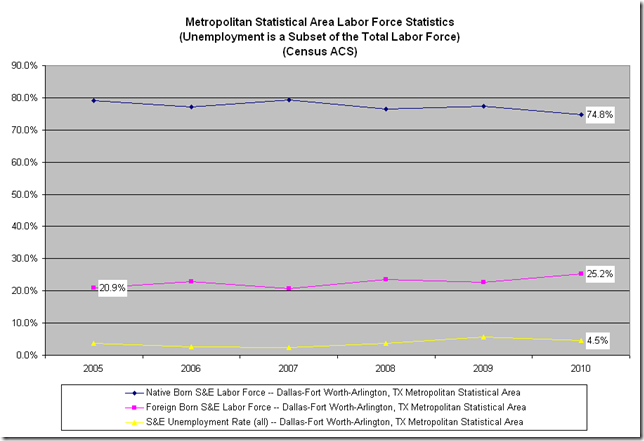
I’ve created some charts that detail the characteristics of the S&E employment picture in the various Metropolitan Statistical Areas (MSA).  The first Chart is the Dallas/Fort Worth MSA, where Jennifer Wedel’s husband has had problem finding Semiconductor Engineering work for the last three years.

If you are not familiar with the Wedel family, you can watch her conversation with President Obama here.


Dallas-Fort Worth-Arlington, TX Metropolitan Statistical Area
image

At first glance we see an S&E Unemployment rate that is fairly high for the Brightest and Best, but we also see a 4.1% increase in the Foreign born in the S&E Labor force for the Dallas Fort Worth MSA. 

The following chart shows that from 2008 to 2010, over 12,000 Native born S&E professionals lost employment, while more than 8,000 Foreign born professionals gained employment (2007 to 2010).

 image

Had these 8,000 jobs stayed with the Native born, the Unemployment Insurance liability for the Dallas Fort Worth MSA would have been for 4,000 professionals instead of 12,000 professionals.  Unemployment Insurance (in California) maximum is $450.00 per week, over the course of a year, benefits for 8,000 formerly well paid professionals would cost $18,720,000.00 to the Texas and Federal Unemployment system(s).


New York-Northern New Jersey-Long Island, NY-NJ-PA Metropolitan Statistical Area

The New York MSA has the largest S&E Labor Force at 447,600

image

The Foreign born S&E share of the Labor Force only grew by 1% in the five years covered. The 6.5% Unemployment rate is rather high for a primarily college educated workforce.


image

In the Chart above, we see elasticity of 30,000 Native born professionals in the New York MSA. The increase in the employment of 30,000 for the Native born only decreased the Unemployment level by about 2,500 in 2006 (this is likely due to the hiring of new college graduates). 

It is interesting to note that the increase in Unemployment from 2008 to 20009, coincides with the decrease in the Employment level of the foreign born.  The drastic drop in employment of the Native born does not show a corresponding rise in Unemployment levels.

From 2009 forward, the 30,000 the newly hired Native born professionals have been dismissed.

San Jose-Sunnyvale-Santa Clara, CA Metropolitan Statistical Area


image

In the Silicon Valley area, we see a 3% increase in the already very high Foreign born S&E Labor force.   Additionally, the 7.6%  Unemployment rate is disturbing for the center of the universe for all things technical.

  image

There does not appear to be the wildcat layoffs of Native born professionals, in the San Jose MSA.

The chart above seems to indicate that for every 15,000 Foreign born professionals that are hired, 3,000 jobs for Native born professionals are created.  The H-1B propaganda machine seems to have their ( “Each H-1B creates Five jobs”) statistics backwards. 


Seattle-Tacoma-Bellevue, WA Metropolitan Statistical Area

This report wouldn’t be complete if the Microsoft Metropolitan Area wasn’t included.

image


The first thing I notice above is that the Foreign born S&E Labor force levels increased by 6.1%


image

In the above Chart, we clearly see the (Native born) labor elasticity of about 18,000 S&E professionals. It also appears that the 2008 recession only affected Native born professionals. 

The  (2005 to 2009) addition of Native born professionals only flattened the Unemployment level, but did not show a decline.  There is however, a rise in Unemployment levels that corresponds with the increasing level of Foreign born professionals.

There is also an odd two year offset in this chart between the commencement of Native born professionals (2005) and the hiring commencement of Foreign born professionals (2007).  It would appear that the Seattle MSA is benefiting from the stricter adjudication of H-1B visas over these past years.

In closing, the data suggests that there is more than adequate labor elasticity in the Native Born S&E Labor Force.  Knowingly or not, High Skill immigration allows US Employers to socialize employment costs onto the Unemployment Insurance System.

I would suggest that we modernize our State Unemployment Claims systems to require the inclusion of occupational titles, so that the need for business-related immigration can be electronically verified regionally.  Additionally, the Department of Labor’s occupational classification for H-1B visa should be updated to the modern NAICS-SOC, rather than the Dictionary of Occupational Titles (DOT), which was last updated in 1991.


Source Data:

Census, Current Population Survey (CPS)

Downloaded from: Population Reference Bureau, March 4, 2012

Source: Population Reference Bureau analysis of the U.S. Census Bureau’s American Community Survey (ACS) internal microdata files.

Definition: Scientists and engineers include people in computer science, engineering, architecture, life science, physical science, and social science occupations.

Notes: Data are subject to both sampling and nonsampling error. A hyphen (-) indicates data are not available