Showing posts with label population. Show all posts

Friday, May 17, 2013

Updated: Employment vs. population growth by decade

5/12/2013

A snapshot of the employment situation  for our children and immigrants.

Back in June of 2010, we found that only 1 job new job for each 20 new persons of working age were created in the decade 2000 to 2010.  Effectively a 95% jobless rate among this segment of the population.
This post revisits the “Employment vs. Population Growth” concept. Lower immigration rates and better employment growth since 2010 has only adjusted the working age jobless rate to 79.5% for the new century.
A funny thing happened after the creation of the World Wide Web, being located in the United States is no longer necessary to participate in the global economy.

In the late 1990s corporations found that they could move production to lower cost economies. Corporations, colleges and immigration attorneys formed unions under the guise of “trade associations” and presented numerous defective economic studies on the benefit of lower cost goods and the virtue of immigrant entrepreneurs, guest workers and foreign exchange students.

Hungry politicians took the bait, hook line and sinker, and we are now faced with a too big to fail situation where our politicians are impotent. We are faced with a crap-sandwich, in the form of a Comprehensive Immigration Reform bill (S 744) that will add millions of employment seeking immigrants per year, while facts at hand are being ignored.

A simple aggregate of Bureau of Labor Statistic household data displays how the employment paradigm has changed since the turn of the century.
  •  Removing the population and employment growth for those 65 and over negates the Baby-Boomer retirement argument.
Employment to Population Growth (Ages 16 through 64)
Decade Population Growth Employment Growth Employment rate
1950s 7,559,000 7,117,000 94.15%
1960s 15,772,000 13,817,000 87.60%
1970s 25,569,000 21,291,000 83.27%
1980s 15,470,000 17,335,000 112.06%
1990s 18,591,000 16,366,000 88.03%
2000 – 2010 22,268,000 1,048,000 4.71%


Selected Period Population Growth Employment Growth Employment rate
2000 – Apr 2013 25,810,000 5,280,000 20.46%
2010 – Apr 2013 3,542,000 4,232,000 119.48%
 
For the first decade of the 2000s, there was only 1 new job created for every 20 working-age entrants into the workforce. In the decade following (2010 to present) employment growth slightly exceeds population growth, but that is largely because of a reduction in population growth.  If the 119.48% rate (2010 to present) continues for the rest of this decade without change, only 12,696,000 jobs will be created for the 2010s.  Roughly 40 million native born children enter the workforce in the decade, while the national mortality rate is about 15 million per decade.  Combining the two time periods, 2000 to present (April 2013), only 1 job has been created for every five new entrants into the workforce (noninstitutionalized population ages 16 through 64).

Effectively, we are experiencing an 79.5% unemployment rate for the population of new working-age adults added to the population since 2000.  Is this the time to blindly double the rate of legal immigration and surrender to illegal immigration without ever trying to enforce the rules of the 1986 IRCA amnesty which described the creation of E-Verify?


Source Data:

Saturday, July 7, 2012

The Migration Metric

We are a nation of immigrants!

We are also a nation that burned coal for home heating and continues to burn coal for electricity.  Just because we have “always” practiced something, does that mean we should continue to do it? Even after we have identified that the practice has problems?

Our open door immigration policy has created a “Catch 22” problem, spiraling housing costs, and the subsequent salary-requirement to service housing costs, have made the United States an unattractive destination for employment creation.  Immigrant competition for employment stagnates wages (as the US dollar devalues) and immigrants compete for housing, causing “sticky” rental housing rates, which reverberate throughout the housing industry.

The following tables demonstrate employment growth by presidential term since 1976. 
“Sample Population” is our control group, which references growth in persons that can only come from native births, or immigration.  The Migration Metric clearly shows that the immigration subsidy affecting labor and housing must be curtailed.


Jimmy Carter
Served 1977–1981
image


Ronald Reagan
Served 1981-1989
image


George H. W. Bush
Served 1989–1993
image


Bill Clinton
Served 1993–2001
image


George W. Bush
Served 2001–2009
image


Barack Obama
Served 2009 – Present
image
Data: January 2009 to June 2012

With only 11% of the added population counted as  entering the Labor Force, and only 24.6% of that new Labor Force finding employment, shouldn’t we stop “burning” our citizens with mass-immigration policy?

Addendum:
There seems to be some confusion about the Obama era and baby-boomers aging out of the work force. 

Through May 2012, the population growth for those 65 and over, grew by 3,924,000.  If we deduct this population from the “Sample”, we would also have to deduct the employment growth in the 65 and over age-group.  Deducting those  1,170,000  jobs from the “Sample” would put the Obama Presidential term employment growth at roughly –900,000 for those under age 65.

Source Data:
BLS  “Labor Force Statistics from the Current Population Survey”
Series title:         (Seas) Population Level -- Series Id:           LNS10000000
Series title:        (Seas) Civilian Labor Force Level -- Series Id:           LNS11000000
Series title:        (Seas) Employment Level -- Series Id:           LNS12000000
Data extracted on: July 6, 2012 (2:22:28 PM)

Thursday, January 5, 2012

Radical Conservative Immigration Policy

“Each 100 H-1B Initial Employment Approvals are associated with 90 job losses for ‘Natives’ from 2001 to 2010.”

We have yet another “study” of immigrants in the United States workforce, this one associates different classes of immigrants with employment creation for “natives”.  The study is short on definitions, does not include a list of assumptions and does not include data, but heck let’s just take the author’s word that all is correct and good.

Today’s Featured Study:

“IMMIGRATION AND AMERICAN JOBS”

AMERICAN ENTERPRISE INSTITUTE FOR PUBLIC POLICY RESEARCH AND THE PARTNERSHIP FOR A NEW AMERICAN ECONOMY

Written by:  Madeline Zavodny
http://www.renewoureconomy.org/aeireport


While the country teeters on the edge of a double dip recession, let’s plug-in some numbers into the formulas that the “conservative” think tanks are promoting as an employment growth solution.  Our goal here is to reduce the Current U-6 Underutilization Rate by 33%, thus creating 8 million jobs for “natives” by allowing more immigration as Ms. Zavodny suggests.

I present “What if” scenario CASE 1: and CASE 2: for creating 8 million jobs for “Natives” as per Zavodny’s policy recommendation.

CASE 1:

Zavodny: “Every additional 100 foreign-born workers with an advanced
degree created an additional 44 jobs for US natives.”

image

In the table above we see that adding 18 million new persons with advanced degrees to the labor force “might” bring the Unemployment rate down to levels that are considered “full employment”. 

On the other hand, if Zavodny’s conclusions are wrong and the economy does not create 26 million new jobs as a result of adding these immigrants, the Headline Unemployment rate (U-3) would climb to 18.3% and the United States would be stuck with 18 million more people to house, clothe and feed.  This would be some pretty high-stakes policy poker.


CASE 2:

Zavodny: “Every additional 100 foreign-born workers who earned
an advanced degree in the US and then worked in
STEM fields created an additional 262 jobs for US natives.”

image

The chart above is a bit more conservative with 2.62 native jobs created for every immigrant with a US advanced STEM degree.  In this case we only need to bring in about 3 million immigrants and dedicate 100% of the science curriculum to STEM disciplines – AND -- dedicate all of the NCES advanced degree programs to immigrants for the next 10 years. 

image

The STEM occupations employ about 7.6 million persons, but only 1.8 million in the STEM occupations have an advanced degree.  Another 3.3 million STEM workers have bachelor’s degrees and about 2.4 million have some college, an associate degree or less. Adding 3 million immigrants to a population which is now only 1.8 million -- might tend to affect wages a little bit.

If the Zavodny Formula for STEM workers were to fail and these new immigrants were to engage in an employment bidding war to remain employed in the United States, the likely result would be another spate of housing foreclosures.   The Census homeownership rate is currently 66.3%, STEM is a well paying field, so failure of this Zavodny Formula could cause slightly more than 2.2 million additional housing foreclosures.  Fresh out of college immigrants would predominately enter the rental housing market.

CASE 3:

Zavodny: “The estimates show that a 10 percent increase in
H-1B workers, relative to total employment, is associated
with a 0.11 percent increase in the native
employment rate. During the sample period of
2001–2010, this translates into each additional 100
approved H-1B workers being associated with an
additional 183 jobs among US natives.”


Okay, we get down to the meat of the “citizenship provisional” visa, the H-1B.  This is the temporary worker program that encourages foreign nationals to squander their youth chasing the dream of US citizenship; it is reasonable to conclude that citizenship will not be awarded until the worker has completed 10 to 15 years of continuous employment. Why? Because corporate lobbyists have favored temporary immigration over the Employment Based Preference entrance visa with a 5 year Lawful Permanent Residence requirement prior to naturalization.

I have no idea how to decipher Zavodny’s statement, “…a 10 percent increase in H-1B workers, relative to total employment…”, is the 10 percent increase a variable in a regression formula? Or, an increase in the actual data? Is the 10 percent H-1B increase offset by a year, or instantaneous?

Displayed below is the actual H-1B Initial Employment Approvals aligned with the Total Loss/Gain in BLS employment levels for the years 2001-2010.

image

I can’t see how Zavodny arrives at a 100 to 183 jobs for “Natives” ratio for the same period, when considering the numbers in the above table, I guess I’ll never understand the new math(s).

Rebuttal Data:

Census Homeownership Data:

http://www.census.gov/hhes/www/housing/hvs/qtr311/graph311.html

Educational Data:

WebCASPAR Integrated Science and Engineering Resources Data System

https://webcaspar.nsf.gov/index.jsp?subHeader=WebCASPARHome

H-1B Initial Employment Approvals:

“USCIS: Characteristics of H-1B Specialty Occupation Workers”

Fiscal Years 2001 through 2009

Employment Level Loss/Gain Data:

Labor Force Statistics from the Current Population Survey

Series Id: LNU00000000

Not Seasonally Adjusted

Series title: (Unadj) Population Level

Labor force status: Civilian noninstitutional population

Type of data: Number in thousands Age: 16 years and over

Data extracted on: January 1, 2012 (3:55:39 PM)

http://www.bls.gov/data/

STEM Employment and Educational Statistics

U.S. Department of Commerce
Economics and Statistics Administration

“STEM: Good Jobs Now and for the Future”

By David Langdon, George McKittrick, David Beede, Beethika Khan, and Mark Doms,
Office of the Chief Economist

Friday, November 11, 2011

Uninformed: “The other 90% are Employed”

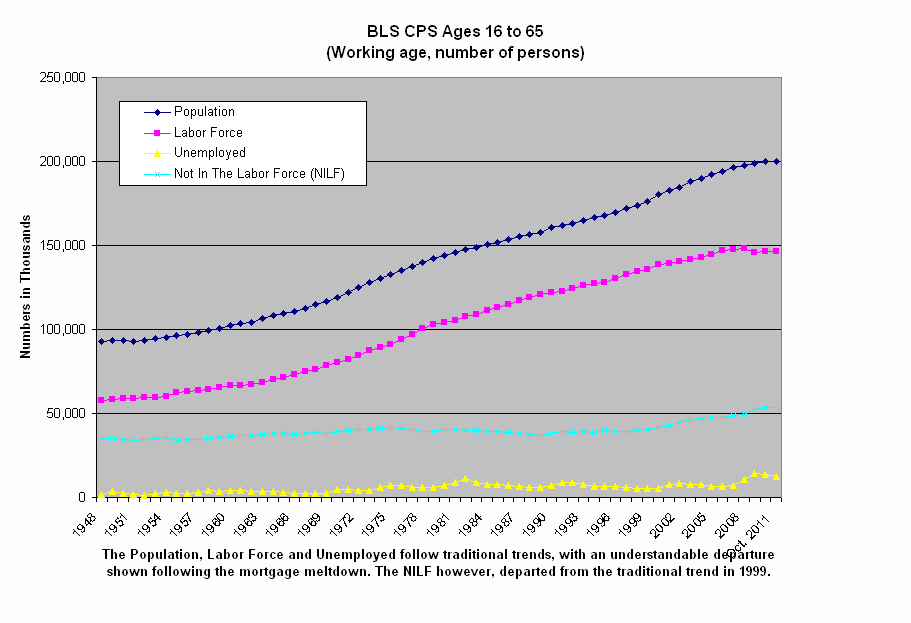
The “U” in the Unemployment rate, might as well stand for the word “Uninformed” for many talking heads, journalists and economists. In fact, 33% of the working age population (16 to 65) are not employed as of Oct. 2011.  (66 million working age persons not employed.)

What Does Concealed Unemployment Mean?
When people who are out of work are not counted in official unemployment statistics for a variety of reasons. Those potential workers falling into this category typically include individuals who have given up looking for employment, those who have taken an early retirement even though they would prefer to still be employed and those with seasonal or part time employment. (source: investopedia.com) 
This paper will be looking at a Bureau of Labor Statistics definition known as “Not In the Labor Force” (NILF). The NILF can conceal problems in Unemployment indicators and labor supply/demand problems caused by increased Population.

Definitions for this document:

Labor Force: The number of persons Employed plus the Unemployed

Unemployed: The number of persons in the age group who are defined in the U-3 “Headline” unemployment rate

Not In the Labor Force: Persons neither employed nor unemployed

Population: The Non-Institutionalized Civilian Population, those counted in the “Labor Force” plus those counted as “Not In the Labor Force”

BLS CPS: Bureau of Labor Statistics, Current Population Survey

End Definitions:

Chart 1 (Click on charts to enlarge)

Displayed in Chart 1, is the entire BLS data record for noted classifications for Ages 16 to 65. Chart 1, is provided to display the historical trends in the various classifications in the working age population.

Chart 1 shows the Population, Labor Force and Unemployed follow traditional trends with an understandable departure following the mortgage meltdown. The NILF however, departed from the long-term trend in 1999.

Chart 2

Chart 2 isolates the long-term trends in the NILF and Unemployment percentage rates, reinforcing the observation made from Chart 1.

Chart 3

Chart 3, focuses on 1999 going forward – starting with a fresh count at the end of year 1998. Thus, Chart 3 displays the “change” since end of year 1998.

There is a lot to absorb in Chart 3. Concerning the NILF, the additions to the NILF have exceeded the additions to the Labor Force (Employed plus Unemployed). The NILF accounts for 52.6% of the 26,229,000 added to the working population. Finally, 57.7% of the additions to the Labor Force were in the Unemployed subcategory.

Chart 4

Chart 4 is provided to display that there is a connection to the NILF and the prior few years’ Unemployment levels. The levels of the NILF category traditionally have fluctuated between 35 million and 40 million before a substantial increase of levels began in the late 1990s. Since the end of 1997, NILF levels have increased by 34.8%.

Also noted in Chart 4 is a change in the average Unemployment levels, From 1948 to 1971 the average Unemployment rate was 4.5%, from 1972 forward the average Unemployment rate has been 6.2%. Since 1981 average unemployment rates have increased by 37.2%.

Note: The significance of 1971 is that President Nixon abandoned the Bretton Woods accord and closed the “Gold Window”. The “Gold Window” was an assurance that Federal debt instruments and Reserve Notes could be redeemed in gold. Closing the “Gold Window” caused the oil embargo and gasoline shortages of the early 1970s. Additionally, two severe depressions in Mexico followed President Nixon's 1971 actions.

Chart 5

Chart 5, shows year over year increase/decrease in levels added to NILF, Unemployed and Population. Chart 5 tends to indicate that lower levels of increase in Population level coincide with lower levels of increase in unemployment rates and lower levels in increase in the NILF category tend to follow.


There is always reserve human capital in the NILF and there are many reasons why people leave the labor force, one reason that is rarely discussed is that many self employed persons refuse to work below the cost of doing business.

Chart 6

Chart 6 deals with U.S. born population increases, population increases from immigration and employment level growth in the 16 to 65 age group. The U.S. born population data is births minus deaths in the birth year, with 16 years added to the birth year to adjust the year these children entered the working age Population.

Note: The Population increases from U.S. births and the Employment level increases are directly relational, the portion of Population increase from immigration may contain persons over the age of 65. For completeness, Employment levels have increased by just over 3 million for persons 65 and older since end of year 1998.

In conclusion, it is clear from Chart 6, that employment growth levels no longer support the United States traditional immigration levels. Charts 1 through 5 demonstrate that concealed unemployment causes the headline Unemployment Rate to be far below the actual rate of unemployment.

Data Sources:


=======================================================
Data Sources: US Department of Labor, Bureau of Labor Statistics
Downloaded 10/09/2011
(Ages "65 years and over" are subtracted from "16 years and over" to determine the various levels in ages 16 to 65)
=======================================================

Series Id: LNU00000000
Not Seasonally Adjusted
Series title: (Unadj) Population Level
Labor force status: Civilian noninstitutional population
Type of data: Number in thousands
Age: 16 years and over

Series Id: LNU00000097
Not Seasonally Adjusted
Series title: (Unadj) Population Level - 65 yrs. & over
Labor force status: Civilian noninstitutional population
Type of data: Number in thousands
Age: 65 years and over

=======================================================

Series Id: LNU01000000
Not Seasonally Adjusted
Series title: (Unadj) Civilian Labor Force Level
Labor force status: Civilian labor force
Type of data: Number in thousands
Age: 16 years and over

Series Id: LNU01000097
Not Seasonally Adjusted
Series title: (Unadj) Civilian Labor Force Level - 65 yrs. & over
Labor force status: Civilian labor force
Type of data: Number in thousands
Age: 65 years and over

=======================================================

Series Id: LNU03000000
Not Seasonally Adjusted
Series title: (Unadj) Unemployment Level
Labor force status: Unemployed
Type of data: Number in thousands
Age: 16 years and over

Series Id: LNU03000097
Not Seasonally Adjusted
Series title: (Unadj) Unemployment Level - 65 yrs. & over
Labor force status: Unemployed
Type of data: Number in thousands
Age: 65 years and over

=======================================================

Series Id: LNU05000000
Not Seasonally Adjusted
Series title: (Unadj) Not in Labor Force
Labor force status: Not in labor force
Type of data: Number in thousands
Age: 16 years and over


Series Id: LNU05000097
Not Seasonally Adjusted
Series title: (Unadj) Not in Labor Force, 65 yrs. & over
Labor force status: Not in labor force
Type of data: Number in thousands
Age: 65 years and over

=======================================================
U.S. Born Population Birth/Death Data
=======================================================
Source: U.S. National Center for Health Statistics,Vital Statistics of the United States, and National Vital Statistics Reports (NVSR).

For more information:
http://www.cdc.gov/nchs/nvss.htm

Internet release date: 09/30/2011
http://www.census.gov/compendia/statab/2012/tables/12s0078.xls

Tuesday, July 27, 2010

Unemployment or Non-Employment: Non-Employment Rate 26.9%

This graph displays a Non-Employment rate of 26.9% among the working age population.  Measuring employment growth to population growth since 1950, persons under age 16 and over age 65 are excluded from the BLS-CPS data-set(s) to make a determination of "working age population" and "working age employment". 

(Click on image to enlarge - a second click on new page may be required for proper resolution.)


The working age population and working age employment data-subsets are aggregated to produce growth statistic(s) starting from end of year levels in 1949.

The "Delta (Non-employment)" growth values are shown as negative for display purposes.  This Delta is the difference between the working age population growth and working age employment growth.  Of the 105,229,000 in the working age population, 28,255,000 were not working on Dec. 31, 2009.  Keep in mind that the BLS-CPS definition of "Employed" is fairly liberal and includes part-time workers.

As a comparison to current levels, in 1998, the working age population growth was 80,662,000 and the non-employed in that population was 6,571,000 (8.1%).

Since 1998, the working age population has increased by 24,567,000 (30.5%) while employment in the working age group increased by only 2,883,000 (3.9%).

Another post that uses these growth statistics...
Employment Growth vs. Population Growth by Decade

Monday, April 20, 2009

Something to Teaparty about.

Current U.S. employment growth is below the levels of the 1950's -- not just in percentages -- in real numbers.

Employment growth when divided by Population growth, to create a percentage statistic, is a meager 19.57%. This means that there has only been one job created for every five persons (16 and older) entering the workforce since Dec. 31, 1999.

How can we bring in over one million legal immigrants per year, if we can't create enough jobs to employ our own children? If this isn't a depression, the government seems hell-bent to create one.

The reason we Teaparty is because our Representatives appear to represent citizens of other countries and Global Corporate Citizens.

1950's
Population Growth = 11,516,000
Employment Growth = 7,215,000 (62.65%)

1960's
Population Growth = 19,449,000
Employment Growth = 13,862,000 (71.27%)

1970's
Population Growth = 30,811,000 (Depression in Mexico)
Employment Growth = 21,224,000 (68.88%)

1980's
Population Growth = 20,865,000
Employment Growth = 17,685,000 (84.76%)

1990's
Population Growth = 21,667,000
Employment Growth = 16,998,000 (78.45%)

2000's (Mar. 2009)
Population Growth = 26,254,000
Employment Growth = 5,137,000 (19.57%)


Avg for previous 1950'- 1990's = (73.20%)
Avg. employment growth for 2000's should/would have been: = 19,218,994

Employment Shortfall 2000-2009 (March) = 14,081,994


From David Ricardo. On Wages

The market price of labour is the price which is really paid for it, from the natural operation of the proportion of the supply to the demand; labour is dear when it is scarce, and cheap when it is plentiful. However much the market price of labour may deviate from its natural price, it has, like commodities, a tendency to conform to it.

It is when the market price of labour exceeds its natural price, that the condition of the labourer is flourishing and happy, that he has it in his power to command a greater proportion of the necessaries and enjoyments of life, and therefore to rear a healthy and numerous family. When, however, by the encouragement which high wages give to the increase of population, the number of labourers is increased, wages again fall to their natural price, and indeed from a reaction sometimes fall below it.

When the market price of labour is below its natural price, the condition of the labourers is most wretched: then poverty deprives them of those comforts which custom renders absolute necessaries. It is only after their privations have reduced their number, or the demand for labour has increased, that the market price of labour will rise to its natural price, and that the labourer will have the moderate comforts which the natural rate of wages will afford.


http://www.fordham.edu/halsall/mod/ricardo-wages.html

Source Data:
BLS CPS Downloaded on 4/20/2009
http://www.bls.gov/data/

Formula: Each decade represents EOY Dec XXX9 to EOY Dec XXX9
Example: Decade of 1950's = Dec 1949 to Dec. 1959.

Series Id: LNU00000000

Not Seasonally Adjusted
Series title: (Unadj) Population Level
Labor force status: Civilian noninstitutional population
Age: 16 years and over

Series Id: LNU02000000
Not Seasonally Adjusted
Series title: (Unadj) Employment Level
Labor force status: Employed
Age: 16 years and over