Showing posts with label Science. Show all posts

Friday, September 13, 2013

STEM Crisis Myth


Three points of interest in this post.

A very good write-up on IEEE Spectrum, I hope they don’t mind that I’m using their image to encourage you to read their article.

The STEM Crisis Is a Myth

By Robert N. Charette
Posted 30 Aug 2013 | 19:28 GMT


“A Matter of Supply vs. Demand: Every year U.S. schools grant more STEM degrees than there are available jobs. When you factor in H-1B visa holders, existing STEM degree holders, and the like, it’s hard to make a case that there’s a STEM labor shortage.”

http://spectrum.ieee.org/at-work/education/the-stem-crisis-is-a-myth


09STEMeducation-1377102567732


Monday, March 5, 2012

Incredible Elasticity in US Science and Engineering Labor Force

In 2010, the Unemployment level for the Science and Engineering Labor force was 426,215.  The average Science and Engineering Labor Force growth was 26,627 yearly (2005 to 2010).  During the same period, the Foreign Born, Science & Engineering Labor force grew by an average of 31,245 per year.

In terms of California Unemployment Benefit levels ($450.00 wk), the preference for foreign professionals costs the various State and Federal Unemployment Agencies $731,133,000.00 per 52 week period. 

See the US S&E heat map from the Population Reference Bureau (Link)

Excel MSA Employment Charts used in this presentation with other Metro Areas available for download. (File > Download)

The American Community Survey(Census ACS) provides data on the Science and Engineering (S&E) Labor Force statics.  The Unemployment level data include the foreign and native born.  It is important to remember that the “Labor Force” consists of the Employed” plus the “Unemployed” when evaluating the information to follow.

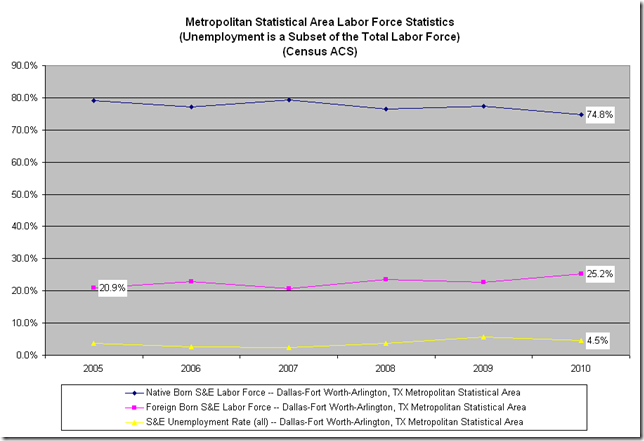
I’ve created some charts that detail the characteristics of the S&E employment picture in the various Metropolitan Statistical Areas (MSA).  The first Chart is the Dallas/Fort Worth MSA, where Jennifer Wedel’s husband has had problem finding Semiconductor Engineering work for the last three years.

If you are not familiar with the Wedel family, you can watch her conversation with President Obama here.


Dallas-Fort Worth-Arlington, TX Metropolitan Statistical Area
image

At first glance we see an S&E Unemployment rate that is fairly high for the Brightest and Best, but we also see a 4.1% increase in the Foreign born in the S&E Labor force for the Dallas Fort Worth MSA. 

The following chart shows that from 2008 to 2010, over 12,000 Native born S&E professionals lost employment, while more than 8,000 Foreign born professionals gained employment (2007 to 2010).

 image

Had these 8,000 jobs stayed with the Native born, the Unemployment Insurance liability for the Dallas Fort Worth MSA would have been for 4,000 professionals instead of 12,000 professionals.  Unemployment Insurance (in California) maximum is $450.00 per week, over the course of a year, benefits for 8,000 formerly well paid professionals would cost $18,720,000.00 to the Texas and Federal Unemployment system(s).


New York-Northern New Jersey-Long Island, NY-NJ-PA Metropolitan Statistical Area

The New York MSA has the largest S&E Labor Force at 447,600

image

The Foreign born S&E share of the Labor Force only grew by 1% in the five years covered. The 6.5% Unemployment rate is rather high for a primarily college educated workforce.


image

In the Chart above, we see elasticity of 30,000 Native born professionals in the New York MSA. The increase in the employment of 30,000 for the Native born only decreased the Unemployment level by about 2,500 in 2006 (this is likely due to the hiring of new college graduates). 

It is interesting to note that the increase in Unemployment from 2008 to 20009, coincides with the decrease in the Employment level of the foreign born.  The drastic drop in employment of the Native born does not show a corresponding rise in Unemployment levels.

From 2009 forward, the 30,000 the newly hired Native born professionals have been dismissed.

San Jose-Sunnyvale-Santa Clara, CA Metropolitan Statistical Area


image

In the Silicon Valley area, we see a 3% increase in the already very high Foreign born S&E Labor force.   Additionally, the 7.6%  Unemployment rate is disturbing for the center of the universe for all things technical.

  image

There does not appear to be the wildcat layoffs of Native born professionals, in the San Jose MSA.

The chart above seems to indicate that for every 15,000 Foreign born professionals that are hired, 3,000 jobs for Native born professionals are created.  The H-1B propaganda machine seems to have their ( “Each H-1B creates Five jobs”) statistics backwards. 


Seattle-Tacoma-Bellevue, WA Metropolitan Statistical Area

This report wouldn’t be complete if the Microsoft Metropolitan Area wasn’t included.

image


The first thing I notice above is that the Foreign born S&E Labor force levels increased by 6.1%


image

In the above Chart, we clearly see the (Native born) labor elasticity of about 18,000 S&E professionals. It also appears that the 2008 recession only affected Native born professionals. 

The  (2005 to 2009) addition of Native born professionals only flattened the Unemployment level, but did not show a decline.  There is however, a rise in Unemployment levels that corresponds with the increasing level of Foreign born professionals.

There is also an odd two year offset in this chart between the commencement of Native born professionals (2005) and the hiring commencement of Foreign born professionals (2007).  It would appear that the Seattle MSA is benefiting from the stricter adjudication of H-1B visas over these past years.

In closing, the data suggests that there is more than adequate labor elasticity in the Native Born S&E Labor Force.  Knowingly or not, High Skill immigration allows US Employers to socialize employment costs onto the Unemployment Insurance System.

I would suggest that we modernize our State Unemployment Claims systems to require the inclusion of occupational titles, so that the need for business-related immigration can be electronically verified regionally.  Additionally, the Department of Labor’s occupational classification for H-1B visa should be updated to the modern NAICS-SOC, rather than the Dictionary of Occupational Titles (DOT), which was last updated in 1991.


Source Data:

Census, Current Population Survey (CPS)

Downloaded from: Population Reference Bureau, March 4, 2012

Source: Population Reference Bureau analysis of the U.S. Census Bureau’s American Community Survey (ACS) internal microdata files.

Definition: Scientists and engineers include people in computer science, engineering, architecture, life science, physical science, and social science occupations.

Notes: Data are subject to both sampling and nonsampling error. A hyphen (-) indicates data are not available

Wednesday, February 1, 2012

Average H-1B Salary 2009

Just a couple of notes on the new NFS document that I found interesting. 

National Science Foundation, “Science & Engineering Indicators 2012”

 Chapter 3. Science and Engineering Labor Force

image

There are a few anomalies again in the NFS salary data for H-1B occupations, in six of the occupations (yellow Colorcode), H-1B workers with a Master’s degree are earning less than those with a Bachelor’s degree. It appears that in all six of these occupations, Master’s degree holders are also earning less than the average for “All degree levels”.

The Grey Colorcode indicates that Master’s degree holders in these occupations earned less than the “All degree level” average.

H-1B visa recipients tend to possess advanced degrees. In FY 2009, 58% of new H-1B visa recipients had an advanced degree, including 40% with master’s degrees, 6% with professional degrees, and 13% with doctorates. This degree distribution differs by occupation, with 83% of mathematical and physical scientists holding advanced degrees (44% with doctorates).  Among life scientists, 87% hold advanced degrees (61% with doctorates).

Chapter 3, “Science & Engineering Indicators 2012”


I believe that the statement above can be paraphrased that 40% of 2009 H-1Bs have Master’s degrees, while 42% have Bachelor’s degrees – anecdotally this indicate a statistically valid sample.  Mathematical, physical and life scientists would appear to have a higher occurrence of  doctorate degrees, simply due to the fact that the NSF took the initiative to mention the fact.

In contrast, in the 2006 data, Master’s degree holders in Computer-related occupations and Writing earned $400.00 per year less than Bachelor’s degree holders in the same occupations.

If we had access to more data, such as the number in each group, location of employment, US or foreign degreed,we could probably make a determination why Master’s degrees appear to losing ground in this population.

A Notable Excerpt on Research & Development  Employment


Between 1994 and 2004, R&D employment in the United States by foreign firms grew slightly faster than R&D employment abroad by U.S. firms. During this period, R&D employment in the United States by majority-owned affiliates 26 of foreign firms rose from 89,800 to 128,500, a 43% increase (figure 3-48). Over the same 10 years, R&D employment by U.S. firms at their majority-owned foreign affiliates grew 35%, from 102,000 in 1994 to 137,800 in 2004.  Adding U.S. parent company R&D employment of 716,400 workers, U.S. MNCs employed 854,200 R&D workers  globally (figure 3-49) in 2004.

The average annual growth in R&D employment abroad by U.S. firms from 1994 to 2004 was 3%.  This shifted their proportion of overseas employment slightly, increasing it from 14% to 16% of total employment.

The 2009 data on MNC R&D employment abroad show a markedly different trend after 2004 from the trend in the preceding decade.  About 85% of MNC R&D employment growth occurred abroad. Whereas employment abroad nearly doubled, domestic employment during the same period grew by less than 5%. As a result, the proportion of MNC R&D employment located outside the  United States went from 16% to 27%. 

The unprecedented increase in U.S. MNC R&D employment abroad contrasts with the continuation of modest growth in R&D employment by foreign firms in the United States. Because of this, unlike in 2004 and prior years, the amount of R&D employment attributed to U.S. MNCs abroad is much larger than the comparable figure for foreign firms in the United States (figure 3-48). The data in figures 3-48 and 3-49 are consistent with two trends discussed in this chapter: growth in S&T employment in the United States coinciding with a general expansion throughout the world of the capacity to do S&T work.

Chapter 3, “Science & Engineering Indicators 2012”

Thursday, January 5, 2012

Radical Conservative Immigration Policy

“Each 100 H-1B Initial Employment Approvals are associated with 90 job losses for ‘Natives’ from 2001 to 2010.”

We have yet another “study” of immigrants in the United States workforce, this one associates different classes of immigrants with employment creation for “natives”.  The study is short on definitions, does not include a list of assumptions and does not include data, but heck let’s just take the author’s word that all is correct and good.

Today’s Featured Study:

“IMMIGRATION AND AMERICAN JOBS”

AMERICAN ENTERPRISE INSTITUTE FOR PUBLIC POLICY RESEARCH AND THE PARTNERSHIP FOR A NEW AMERICAN ECONOMY

Written by:  Madeline Zavodny
http://www.renewoureconomy.org/aeireport


While the country teeters on the edge of a double dip recession, let’s plug-in some numbers into the formulas that the “conservative” think tanks are promoting as an employment growth solution.  Our goal here is to reduce the Current U-6 Underutilization Rate by 33%, thus creating 8 million jobs for “natives” by allowing more immigration as Ms. Zavodny suggests.

I present “What if” scenario CASE 1: and CASE 2: for creating 8 million jobs for “Natives” as per Zavodny’s policy recommendation.

CASE 1:

Zavodny: “Every additional 100 foreign-born workers with an advanced
degree created an additional 44 jobs for US natives.”

image

In the table above we see that adding 18 million new persons with advanced degrees to the labor force “might” bring the Unemployment rate down to levels that are considered “full employment”. 

On the other hand, if Zavodny’s conclusions are wrong and the economy does not create 26 million new jobs as a result of adding these immigrants, the Headline Unemployment rate (U-3) would climb to 18.3% and the United States would be stuck with 18 million more people to house, clothe and feed.  This would be some pretty high-stakes policy poker.


CASE 2:

Zavodny: “Every additional 100 foreign-born workers who earned
an advanced degree in the US and then worked in
STEM fields created an additional 262 jobs for US natives.”

image

The chart above is a bit more conservative with 2.62 native jobs created for every immigrant with a US advanced STEM degree.  In this case we only need to bring in about 3 million immigrants and dedicate 100% of the science curriculum to STEM disciplines – AND -- dedicate all of the NCES advanced degree programs to immigrants for the next 10 years. 

image

The STEM occupations employ about 7.6 million persons, but only 1.8 million in the STEM occupations have an advanced degree.  Another 3.3 million STEM workers have bachelor’s degrees and about 2.4 million have some college, an associate degree or less. Adding 3 million immigrants to a population which is now only 1.8 million -- might tend to affect wages a little bit.

If the Zavodny Formula for STEM workers were to fail and these new immigrants were to engage in an employment bidding war to remain employed in the United States, the likely result would be another spate of housing foreclosures.   The Census homeownership rate is currently 66.3%, STEM is a well paying field, so failure of this Zavodny Formula could cause slightly more than 2.2 million additional housing foreclosures.  Fresh out of college immigrants would predominately enter the rental housing market.

CASE 3:

Zavodny: “The estimates show that a 10 percent increase in
H-1B workers, relative to total employment, is associated
with a 0.11 percent increase in the native
employment rate. During the sample period of
2001–2010, this translates into each additional 100
approved H-1B workers being associated with an
additional 183 jobs among US natives.”


Okay, we get down to the meat of the “citizenship provisional” visa, the H-1B.  This is the temporary worker program that encourages foreign nationals to squander their youth chasing the dream of US citizenship; it is reasonable to conclude that citizenship will not be awarded until the worker has completed 10 to 15 years of continuous employment. Why? Because corporate lobbyists have favored temporary immigration over the Employment Based Preference entrance visa with a 5 year Lawful Permanent Residence requirement prior to naturalization.

I have no idea how to decipher Zavodny’s statement, “…a 10 percent increase in H-1B workers, relative to total employment…”, is the 10 percent increase a variable in a regression formula? Or, an increase in the actual data? Is the 10 percent H-1B increase offset by a year, or instantaneous?

Displayed below is the actual H-1B Initial Employment Approvals aligned with the Total Loss/Gain in BLS employment levels for the years 2001-2010.

image

I can’t see how Zavodny arrives at a 100 to 183 jobs for “Natives” ratio for the same period, when considering the numbers in the above table, I guess I’ll never understand the new math(s).

Rebuttal Data:

Census Homeownership Data:

http://www.census.gov/hhes/www/housing/hvs/qtr311/graph311.html

Educational Data:

WebCASPAR Integrated Science and Engineering Resources Data System

https://webcaspar.nsf.gov/index.jsp?subHeader=WebCASPARHome

H-1B Initial Employment Approvals:

“USCIS: Characteristics of H-1B Specialty Occupation Workers”

Fiscal Years 2001 through 2009

Employment Level Loss/Gain Data:

Labor Force Statistics from the Current Population Survey

Series Id: LNU00000000

Not Seasonally Adjusted

Series title: (Unadj) Population Level

Labor force status: Civilian noninstitutional population

Type of data: Number in thousands Age: 16 years and over

Data extracted on: January 1, 2012 (3:55:39 PM)

http://www.bls.gov/data/

STEM Employment and Educational Statistics

U.S. Department of Commerce
Economics and Statistics Administration

“STEM: Good Jobs Now and for the Future”

By David Langdon, George McKittrick, David Beede, Beethika Khan, and Mark Doms,
Office of the Chief Economist

Sunday, March 30, 2008

April -- H-1B -- Fools

The National Science Foundation has published a document entitled, "Science and Engineering Indicators 2008." One very interesting point for 2006 was that Computer-related and Writers occupations in H-1B workers with a Bachelor’s degree, earned on average, $400.00 more per year than those with a Master’s degree.

The document also states:
"In 2006, 44% of those receiving new H-1B visas in computer-related occupations
had master's degrees, and a little more than 1% had doctoral degrees."

"In 2006, 51% of new H-1B recipients were in computer-related occupations, including 48% in the United States Citizenship and Immigration Services occupational category of "occupations in systems analysis and programming," which includes many S&E occupations, such as computer scientist, and technician occupations, such as programmer. "

"Over two-thirds of the slightly more than 110,000 recipients of H-1B visas in 2006
are in S&T [Science & Technology] occupations."

"Total 2006 new H-1B visas approved: 113,593."
Checking the numbers, the computer-related H-1Bs would total 57,932 and 44%, those with Master’s degrees were 25,490 H-1Bs. With only a little over 1% with Doctoral degrees, the Bachelor’s and Master’s holders were significant samples and comparative in number.

2006 Computer-related occupations H-1B Average Salaries:
Bachelor’s Degree = $56,000.00
Master’s Degree = $55,600.00
2006 Writers occupation H-1B Average Salaries:
Bachelor’s Degree = $37,900.00
Master’s Degree = $37,500.00
http://www.nsf.gov/statistics/seind08/c3/tt03-29.htm

What happened in FY 2006, that drove salaries down for Master's degree holders in Computer-related & Writers occupations? This was the first year of the 20,000 visa, U.S. postgraduate degree exception to the H-1B program. The FY 2006 application date was 4/1/2005, admission commenced on 10/1/2005.

. 20,000 cap exemption for U.S. masters and higher. Up to 20,000 aliens with masters or higher-level degrees from U.S. institutions of higher education will be exempt from the H-1B cap each year. Petitions for such individuals that are filed after the 20,000 exemptions are granted will be counted against the cap. Note: this does not impact the general exemption from the cap for individuals employed by institutions of higher education; that exemption remains. Effective date: March 8, 2005. [Sec. 425]. [Note: No further details of how this will be implemented have been announced.] http://www.oiss.yale.edu/visa/h1refact.htm

Restating other information taken from the NSF document, computer-related H-1Bs were 51% (57,932 ) of 113,593 H-1B approved, but computer-related H-1Bs were 68.16% of the 85,000 non-exempt H-1B cap.

The NSF hasn’t published detailed S&E graduation statistics since 2003, but the "Science and Engineering Indicators 2008" report did leak a little information on 2005 graduation data.


I guess that Bill Gates used the CRA – Taulbee (partial) educational studies and must not have been aware of this good news from the NSF when he recently addressed Congress:


Gates: "If the problem with High Schools is one of quality, the issue at our Universities is quantity, our higher education system does not produce enough top scientists and engineers to meet the need of the U.S. economy. According to the Bureau of Labor Statistics, we are adding over 100,000 new computer related jobs each year, but only 15,000 students earned bachelor degrees in Computer Science and Engineering in 2006 and that number continues to drop." (3/12/2008 -- video 04:14)

The "100,000 computer related jobs each year" depends upon how you look at the data.

Computer related employment growth (BLS - OES)
2001 = (-92,870)
2002 = (-42,090)
2003 = 86,800
2004 = 238,880
2005 = 21,690
2006 = 114,190
Total = 326,600
Avg. per year = 54,433

From the immigrant's point of view, the tragedy of the H-1B and L-1 visa programs, are the backlogs they have created in the Employment based (EB) greencard system. If 100% of the foreign S&E graduates were accepted into the EB program, they would only consume 52% of the 120,120 visas available per year to First through Third preference categories.

(EB 1,EB-2,EB-3s are recaptured http://travel.state.gov/visa/immigrants/types/types_1323.html)

The declining permanent residence and citizenship options for S&E graduates are depicted in NSF figure 3-61. http://www.nsf.gov/statistics/seind08/c3/fig03-61.htm

click to enlarge image


Here is some recent pro-H1-B information that claims there is a labor crisis in the American S&E labor pool. The National Foundation for American Policy (NFAP) has published a study entitled, "TALENT SEARCH : JOB OPENINGS AND THE NEED FOR SKILLED LABOR IN THE U. S. ECONOMY." http://www.nfap.net/pdf/080311talentsrc.pdf

The NFAP takes a subjective look at the job openings from various advertisements for talent from large corporations for Dec. 07 and Jan.-Feb. 08. When we look at the data objectively, we find that the BLS Unemployment rate for college graduates 25 and over, is quite similar to the vacancy rate for the Top 30 corporations in the NFAP list.
http://www.nfap.net/pdf/080311talentsrc.pdf

In terms of employment, the size of each company, compared to vacancies (53,636), the vacancy rate is only 2.27%. The vacancy rate is very close to national unemployment data. Is it somehow the responsibility of our Government to ensure that corporations experience a 0% vacancy rate?

Series Id: LNS14027662
Seasonal Adjusted
Series title: (Seas)
Unemployment Rate – Bachelor’s degree and higher, 25 yrs. & over
Labor force status: Unemployment rate
Type of data: Percent
Age: 25 years and over Educational attainment: College graduates


Unemployed College Graduates


December 2007 = 2.2% (972,000)
January 2008 = 2.1% (953,000)
February 2008 = 2.1% (944,000)


Defining the problems associated with economic immigration:
Immigration and the housing meltdown are interrelated -- the pool of qualified buyers has been depleted with excessive demand for housing and excessive supply of labor in relation to employment growth. The government's solution? Throw more immigrants at the problem.


Corporations are asking for immigration increases commensurate with the size of the population, but our natural resources and infrastructure capabilities, increase at a more static rate. Thus, the fixed immigration rate is the correct immigration policy.

The H-1B and L-1 visas have damaged the more desirable Employment based greencard system. Due to over-subscription, employers cannot offer the greencard path as part of the initial employment offer.

The H-1B and L-1 are unique from all other non-immigrant visas, these non-immigrants are not required to maintain a relationship with the home country. Per diem costs for the employer are eliminated, these types of visas are hyper-competitive because employers are not required to pay a housing allowance -- in addition to the full wage.

The H-1B and L-1 visas have caps. The Employment based EB have quotas. The quota system is to encourage diversity in AMERICA, just because a country has a larger population is of no concern to American immigration policy.

USCIS does not keep departure information on non-immigrants, this could easily be accomplished with a swipe card-issued at customs to be kept with the passport. Allowing work-related non-immigrant visas, without keeping departure statistics is not good policy and a good argument against raising any current caps or quotas.

Source:
National Science Foundation: "Science and Engineering Indicators 2008"
Chapter 2. Section: Higher Education in Science and Engineering
http://www.nsf.gov/statistics/seind08/c2/c2s4.htm
Chapter 3. Section: Global S&E Labor Force and the United States
http://www.nsf.gov/statistics/seind08/c3/c3s4.htm

National Foundation for American Policy:
"TALENT SEARCH : JOB OPENINGS AND THE NEED FOR SKILLED LABOR IN THE U. S. ECONOMY." http://www.nfap.net/pdf/080311talentsrc.pdf

Thursday, February 14, 2008

Science & Engineering Grads -- Not Employed

Table 3-12 below is copied from a National Science Foundation report: "Science and Engineering Labor Force." In Chapter 3, page 28, we find a curious statistic -- unemployment for 'Temporary residents' improves from the highest unemployment levels, to the lowest unemployment levels in the table over the course of 10 years. (PDF)


The national (Seas) Unemployment Rate in 1993 went from a high of 7.3% in January to a low of 6.5% in December (1993 avg. unemployment 6.91%.) The Unemployment rate for 2003 averaged 5.99%. (Hispanic Americans and temporary residents were the only S&E categories that improved with the lower national unemployment rate.)

The next chart is extracted from Bureau of Labor Statistics data...


While I was poking around on the NSF website, I noticed that NSF provides a "Not employed & not full-time student" category for the prior year's graduates. I thought it might be interesting to compare the two most recent datasets, examining how 2001-02 graduates fared against the 1997-98 graduates and the general population.

To keep things in persepective, I looked up the national Unemployment rates and provided averages for the years in question. One might assume that our brightest and best S&E new graduates would fare better than the population at large, but that does not appear to be the case.

(click on image to enlarge)

Bachelor's degrees:
Master's Degrees:

The data in this blog is the most current that I'm aware of.

National Science Foundation data:
Master's degrees
http://www.nsf.gov/statistics/nsf03319/tables/tabs2.xls
http://www.nsf.gov/statistics/nsf06329/tables/tab2.xls

Bachelor's degrees
http://www.nsf.gov/statistics/nsf06329/tables/tab1.xls
http://www.nsf.gov/statistics/nsf03319/tables/tabs1.xls

BLS Foreign Born

http://www.bls.gov/news.release/forbrn.t05.htm

NSF "Science and Engineering Labor Force." Chapter 3

http://www.nsf.gov/statistics/seind08/pdf/c03.pdf